Topics
Medical image analysis
- WaVelocity - Cardiovascular Image Analysis Software
- Robust Segmentation Methods for Aortic Pulse Wave Velocity Measurement
- Skeletonization and segmentation for cerebral vessel delineation
- Generalized profiling with application to arteriovenous malformation segmentation
- Segmentation of lung airways
- Skeletonization for best path calculation in 3-D MRI images of blood vessels
- Fast and memory-efficient 3D segmentation and morphology
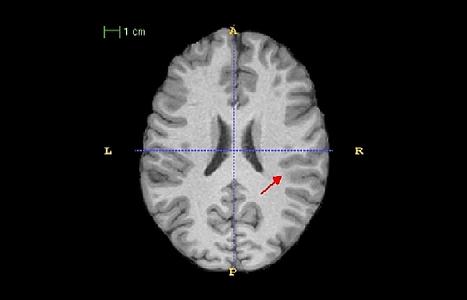
- Focal Cortical Dysplasia (FCD) Detection in MRI
- Diffusion MRI data analysis and processing
- MRI segmentation of the developing newborn brain
Medical image restoration
- Parallel MRI+compressive sensing
- Shearlet regularization for compressive sensing MRI
- Denoising of medical images
Medical image/video quality assessment
- Medical image and video quality assessment
- Task-based QA using numerical model observers
- Task-based QA for interventional X-ray sequences
- DICOM calibration of medical stereoscopic displays
- Subjective QA in medical imaging
- Video latency in laparoscopic surgery
Novel imaging techniques
Biological imaging
- Automatic plant phenotyping using image analysis
- Estimation of objects' features in biological images
- Analysis of high-throughput screening of C. elegans Images
WaVelocity - Cardiovascular Image Analysis Software
WaVelocity is a software app designed for thorough MRI analysis of aorta, with possible application to other types of cardiovascular structures (AVMs, aneurysms, blood vessel trees such as of live or tubular structures such as lungs). Listed bellow are the main features of WaVelocity.
General features: validated Pulse Wave Velocity (PWV) measurement, validated centerline extraction, PWV cross-sectional, PWV para-sagittal, velocity curves analysis, aortic segmentation, diameter and distensibility, blood flow quantification, easy reporting.
Centerline extraction from: 3D anatomical images contrasted (trueFisp), 3D anatomical images non-contrasted (HASTE), 3D anatomical contrast-enhanced images, 3D+time Phase-Contrast images, 3D anatomical CT images, easy manual centerline creation and connection to OsiriX (can be called as a plugin).
Velocity curves time shift computation methods: cross correlation, foot of the curve, steepest slope, extreme values, median values.
Supported data types: 4D (3D+time) images, 4D (3D+time) centerlines, 4D (3D+time) meshes, signals, tables and vectors (profiles).
Image processing: Loading 4D images from DICOM and VTK, segmentation, skeletonization, morphology, measurements on binary images, general image processing methods.
Skeleton processing: Loading, saving 4D centerlines, centerlines from images and positions, multiple scalars in centerlines, best path calculation,maximum flow paths, graph analysis, image reconstruction from centrelines, centerline tree separation (e.g. used in liver decomposition), landmark extraction (e.g. AVM delineation).
Advanced User Interface: Friendly UI - context menus, data drag&drop, Image 3D+time, 2D+time viewers (4 pane), 3D+time scene viewer, signal charts, multi-sheet tables, report generator, user documentation generator, plugin generator (for easy extension). For more information please find the presentation of Wavelocity software.
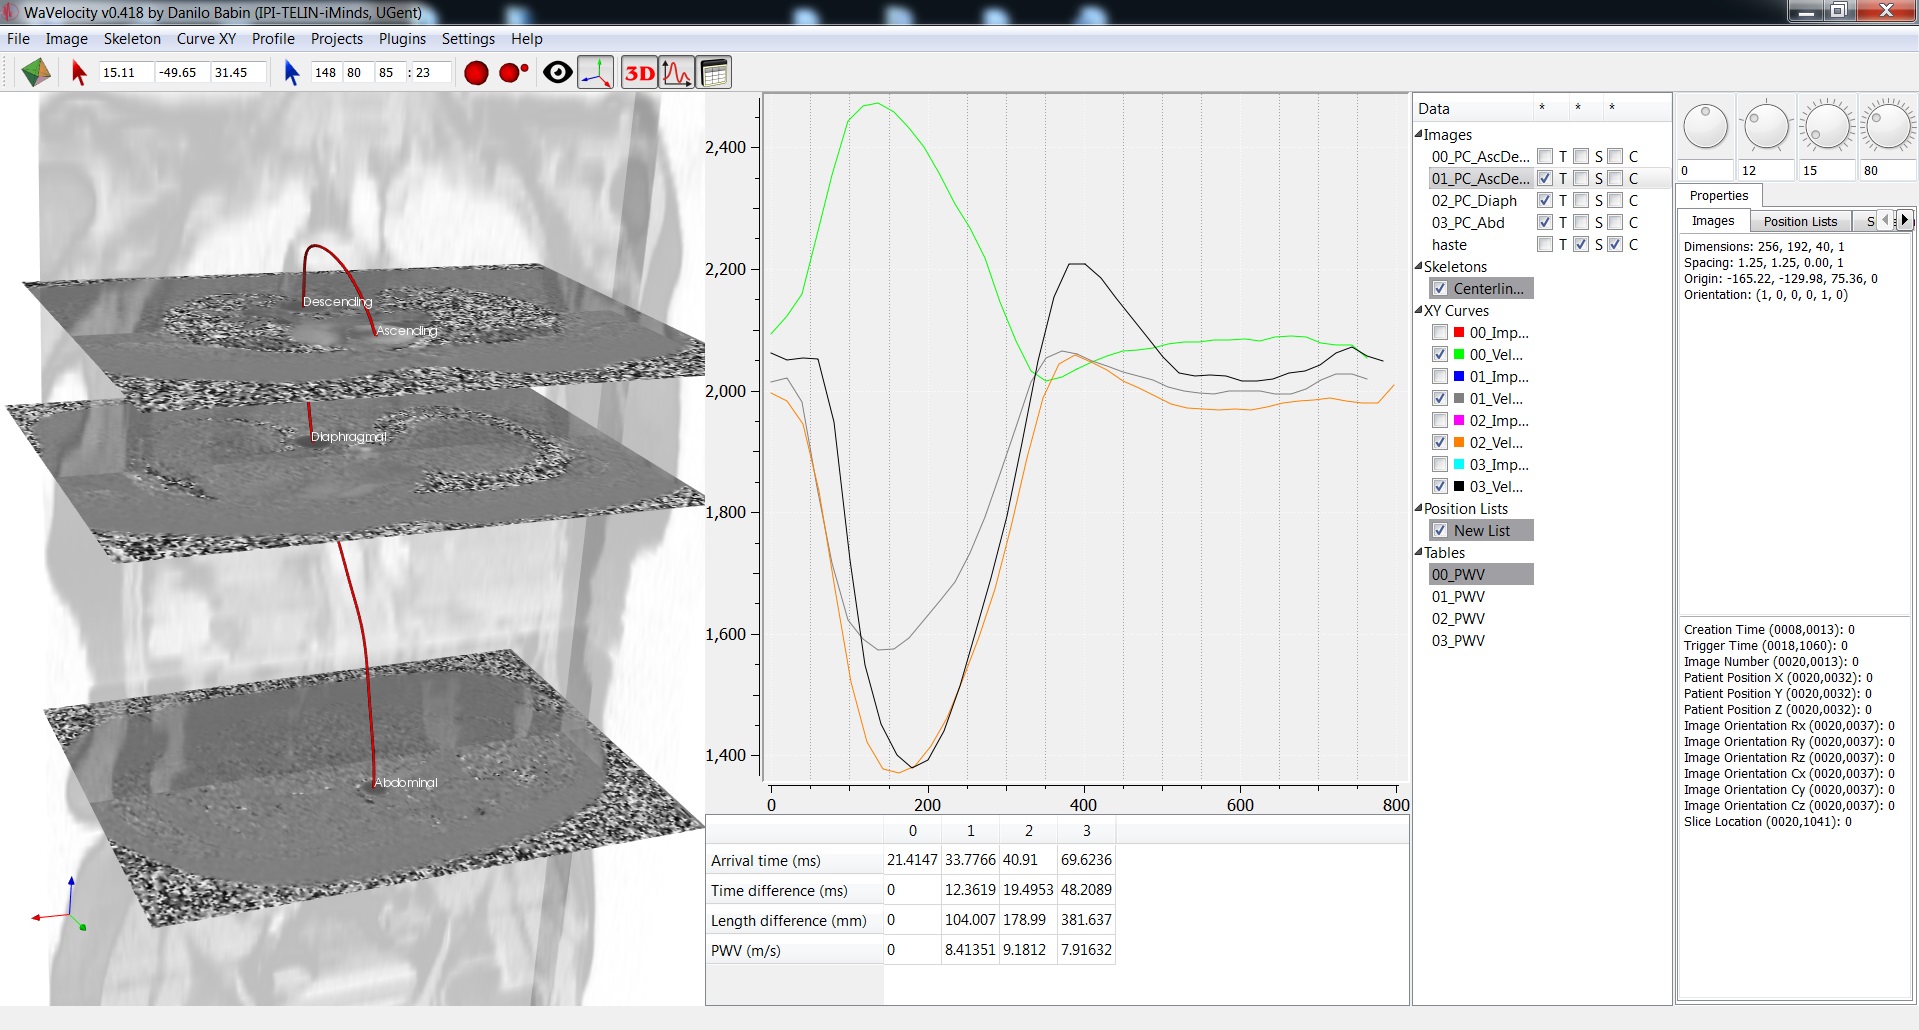
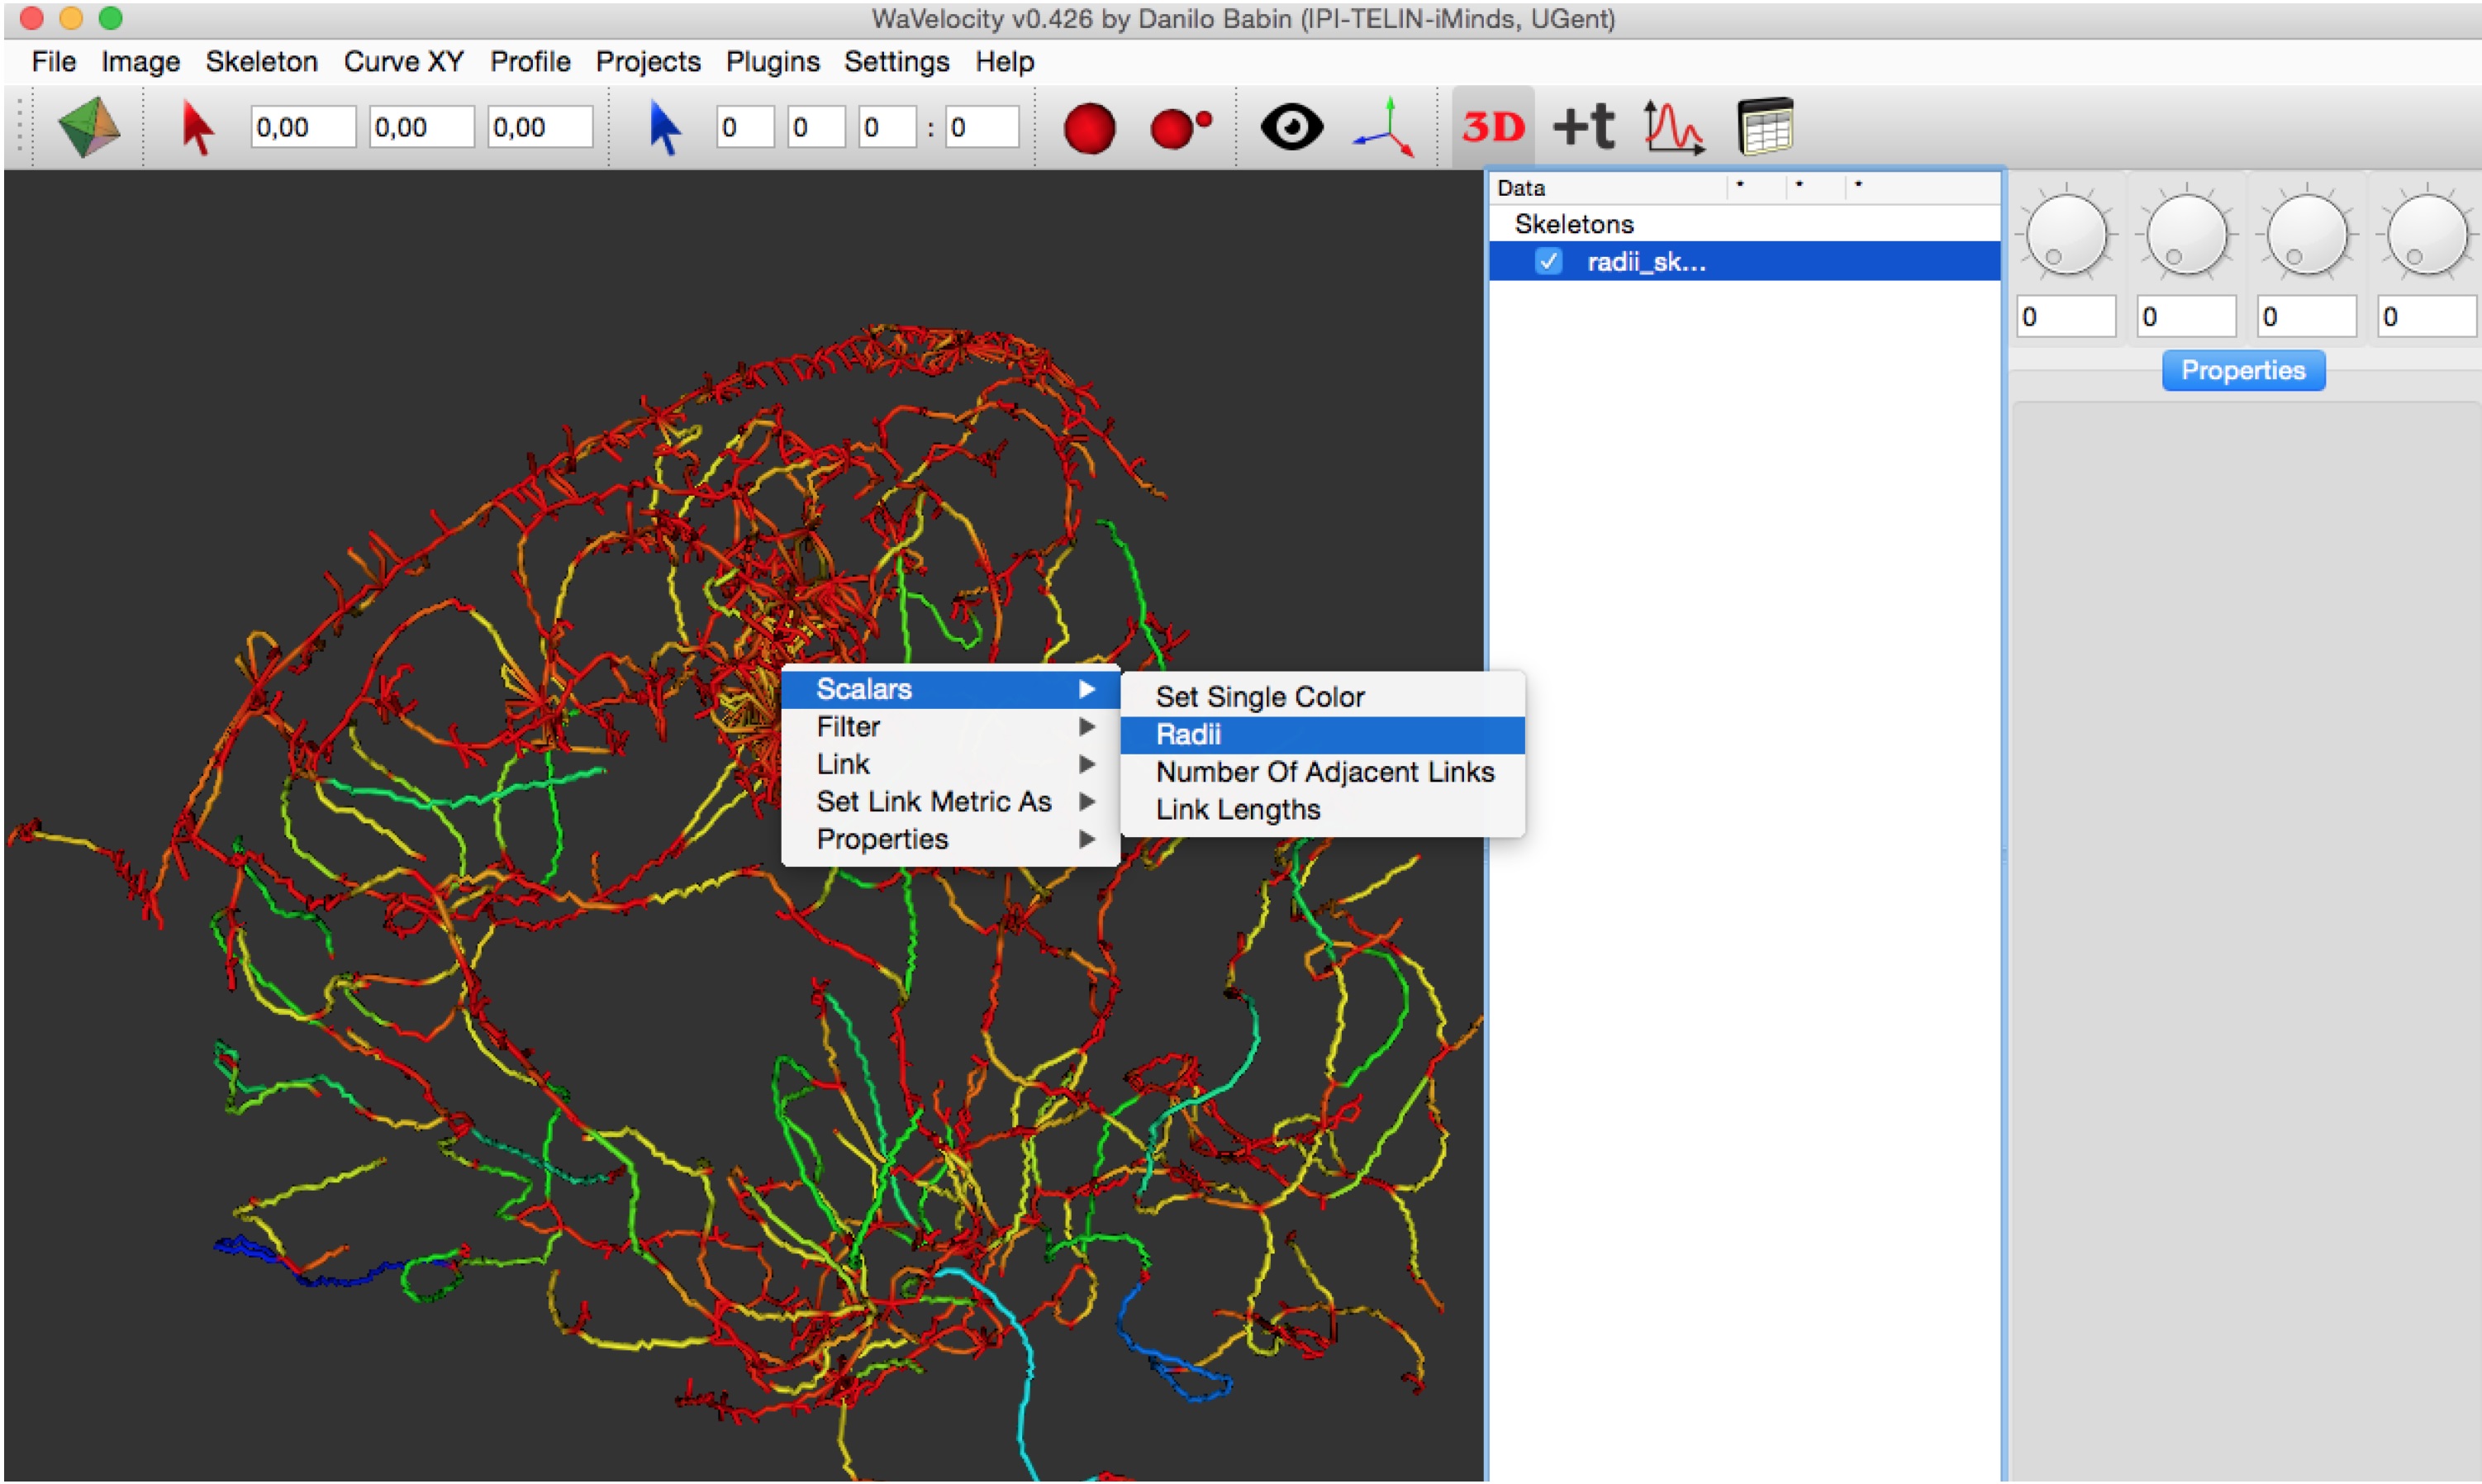
Figure 1: Wavelocity software
References:
- D. Babin, D. Devos, A. Pižurica, J. Westenberg, E. Vansteenkiste, W. Philips, "Robust Segmentation Methods With an Application to Aortic Pulse Wave Velocity Calculation", In Computerized Medical Imaging and Graphics, vol. 38, no. 3, pp. 179 - 189, 2014.
Contact: dr. ir. Danilo Babin
Robust Segmentation Methods for Aortic Pulse Wave Velocity Measurement
Aortic stiffness is an important diagnostic factor that can be well estimated through the pulse wave velocity (PWV) measurement. Data set consists of a 3-D MRI image of abdomen, with four pairs of "cine" and "phase" images at abdominal, diaphragmal, descending and ascending levels of abdominal aorta. We develop robust gay-scale skeletonization method for determining the centerline of abdominal aorta, applicable both on non-contrast enhanced and contrasted images and a robust method for segmenting the "cine" images, where the phase shift motion artifacts are present. The velocity graphs are calculated by mapping the segmented area in "cine" images to corresponding "phase" images. The PWV is obtained from the centerline distances and time shifts of different velocity graphs.
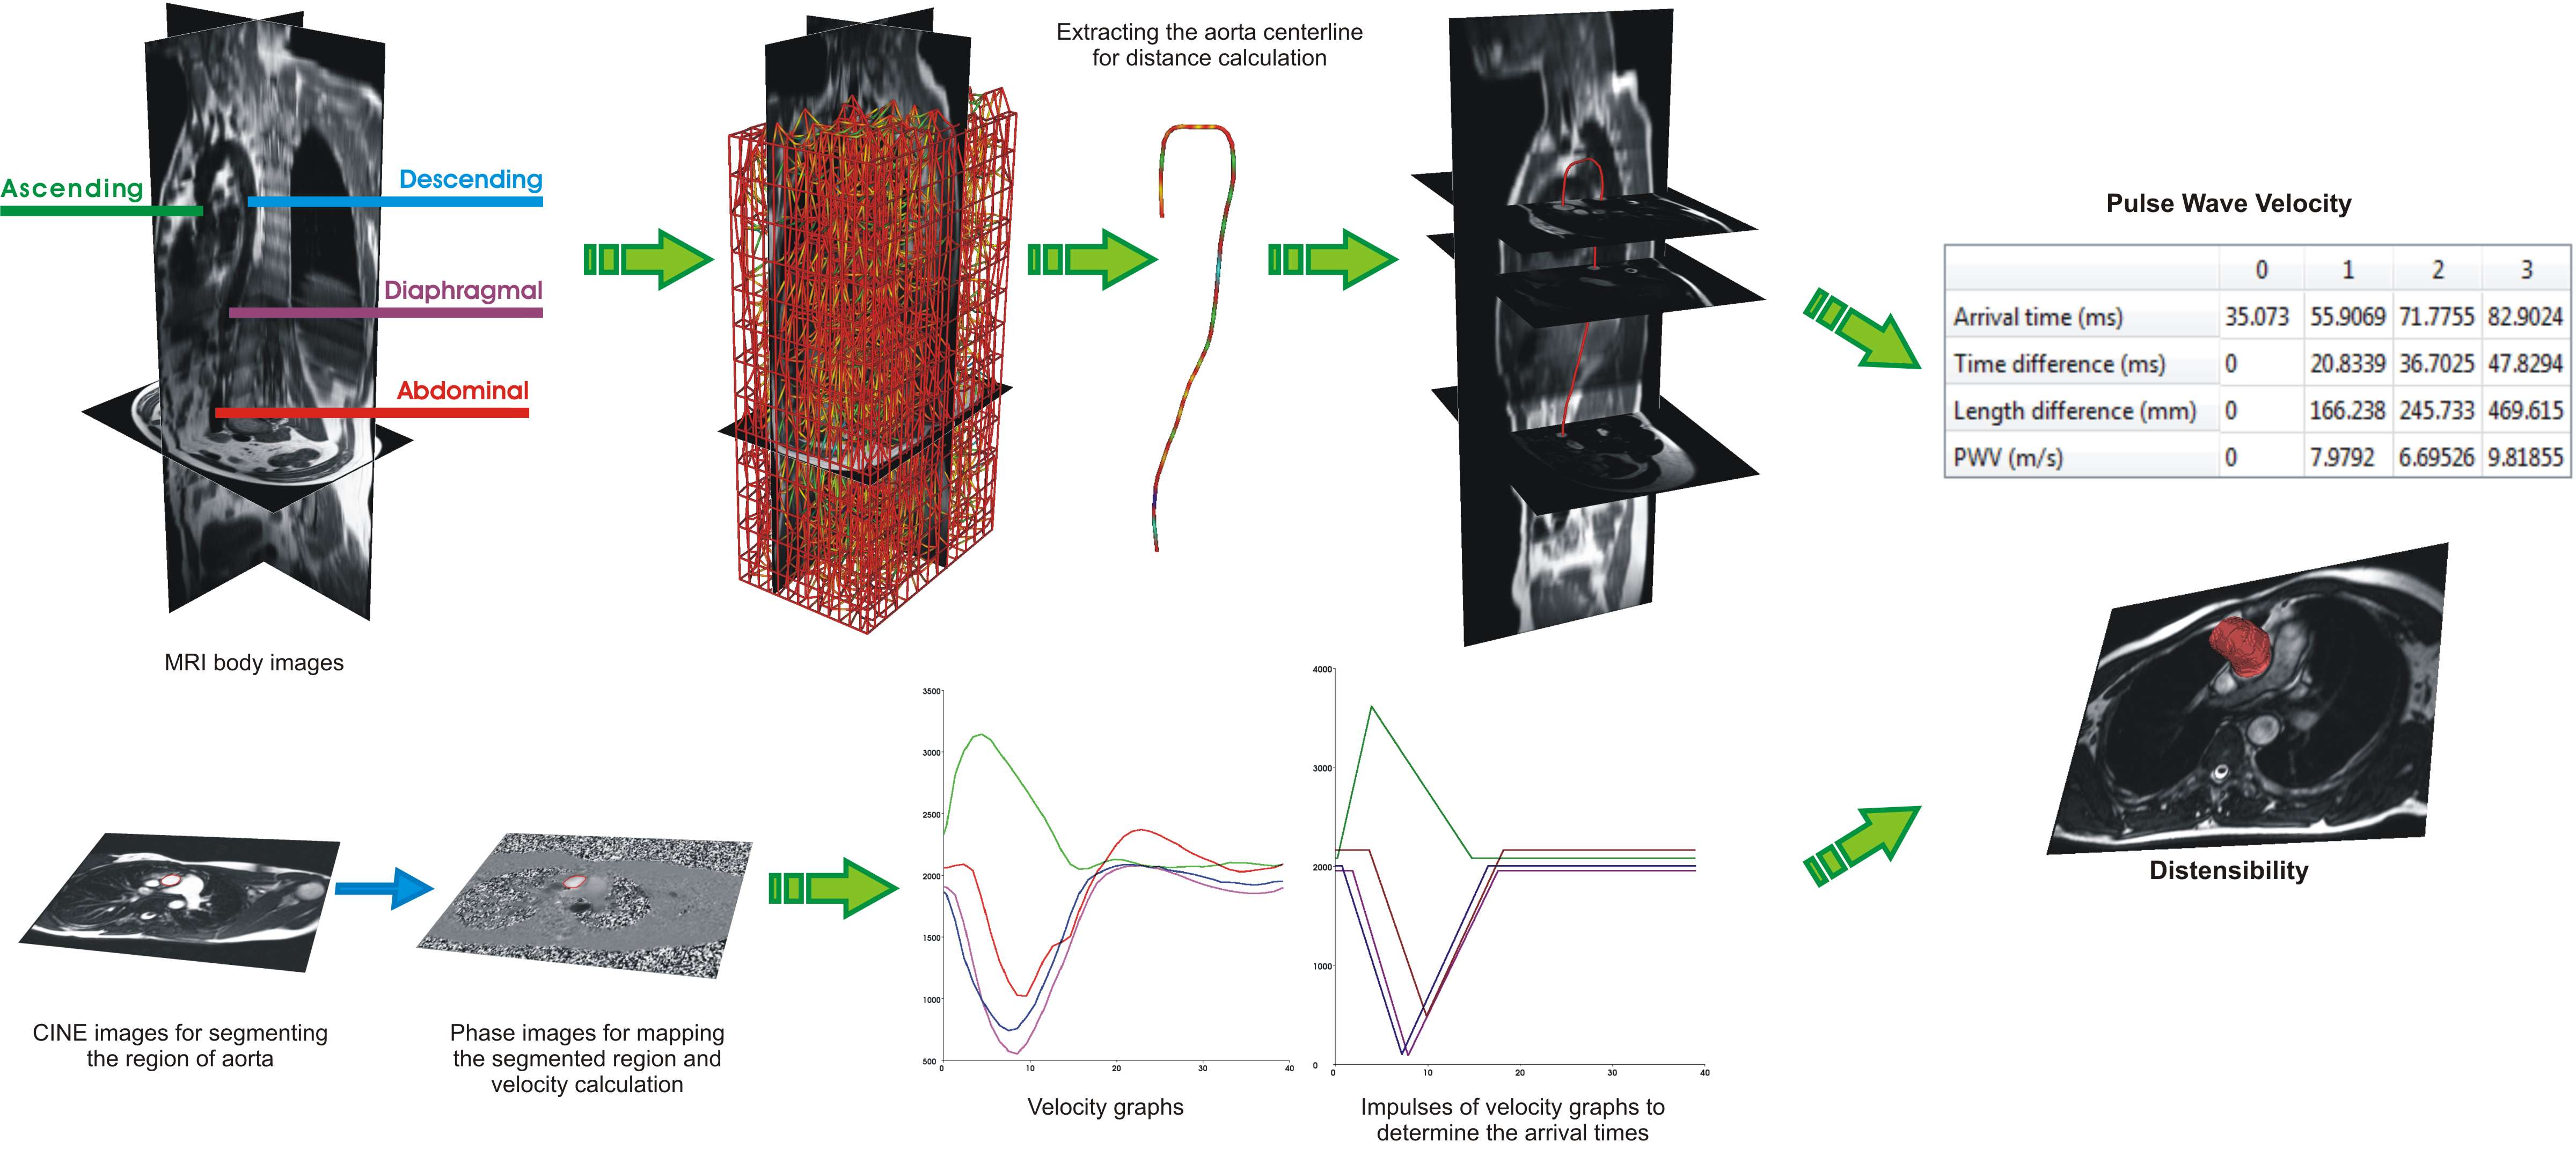
References: - Babin, D. et al. Segmentation and length measurement of abdominal blood vessels in 3-D MRI images. EMBC (31) Proceedings, 399-402, 2009.
Contact: dr. ir. Danilo Babin
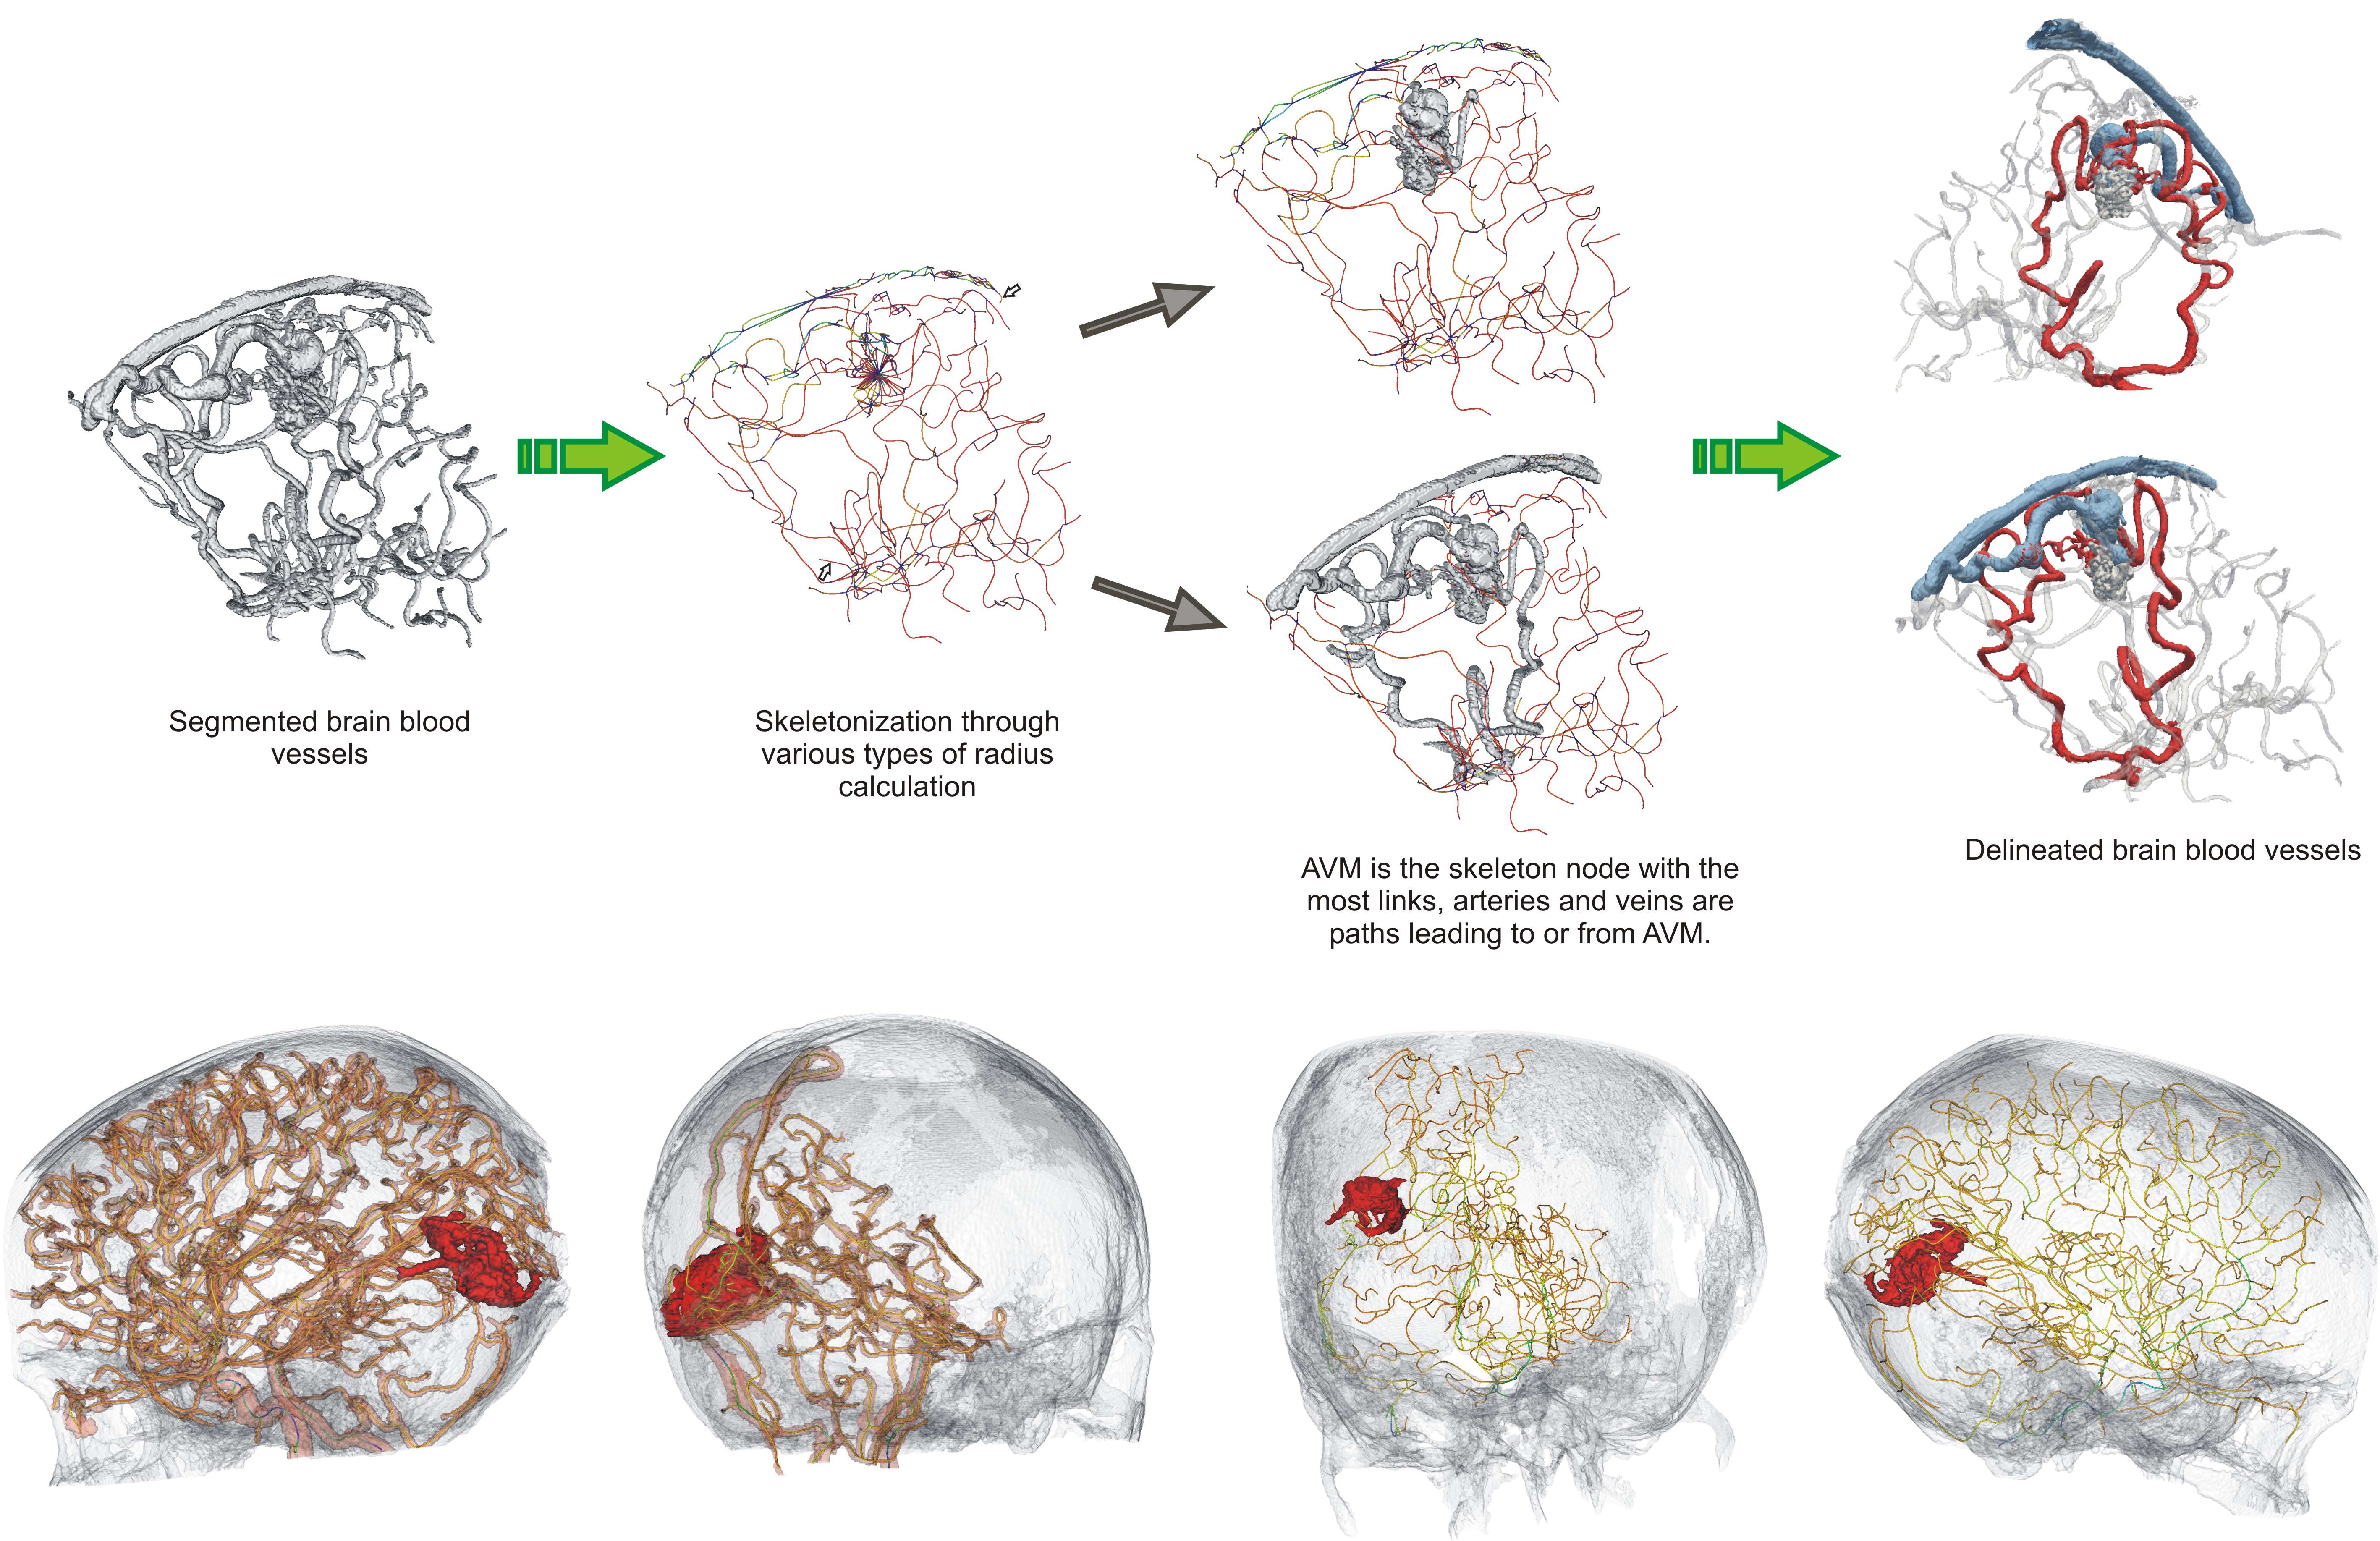
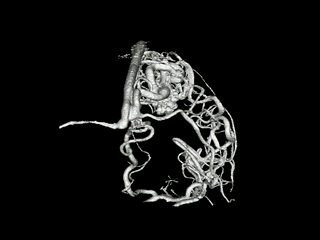
Skeletonization and segmentation for cerebral vessel delineation
The main problem in surgery on brain vessels is that in most cases place of operation cannot be accessed directly, therefore an alternative entry point has to be used. For this, the entry point has to be determined, which would allow the easiest access to the place of operation. We develop the skeletonization method for finding the best path between two points in the blood vessel system of the brain, using our advanced projection-based segmentation of brain blood vessels. Our application allows quick examination of multiple alternative paths based on different requirements and optimization criterion. Based on the obtained segmentation and skeletonization, we delineate the blood vessels into arterial and venous vessels.
References:
Babin, D. Et al. The shortest path calculation between points of interest in 3-D MRI images of blood vessels. ProRISC Proceedings, 295-298, 2008.
Babin, D. et al. Segmentation of brain blood vessels using projections in 3-D CT angiography images. EMBC (33) Proceedings, 8475-8478, 2011.
Contact: dr.ir. Danilo Babin
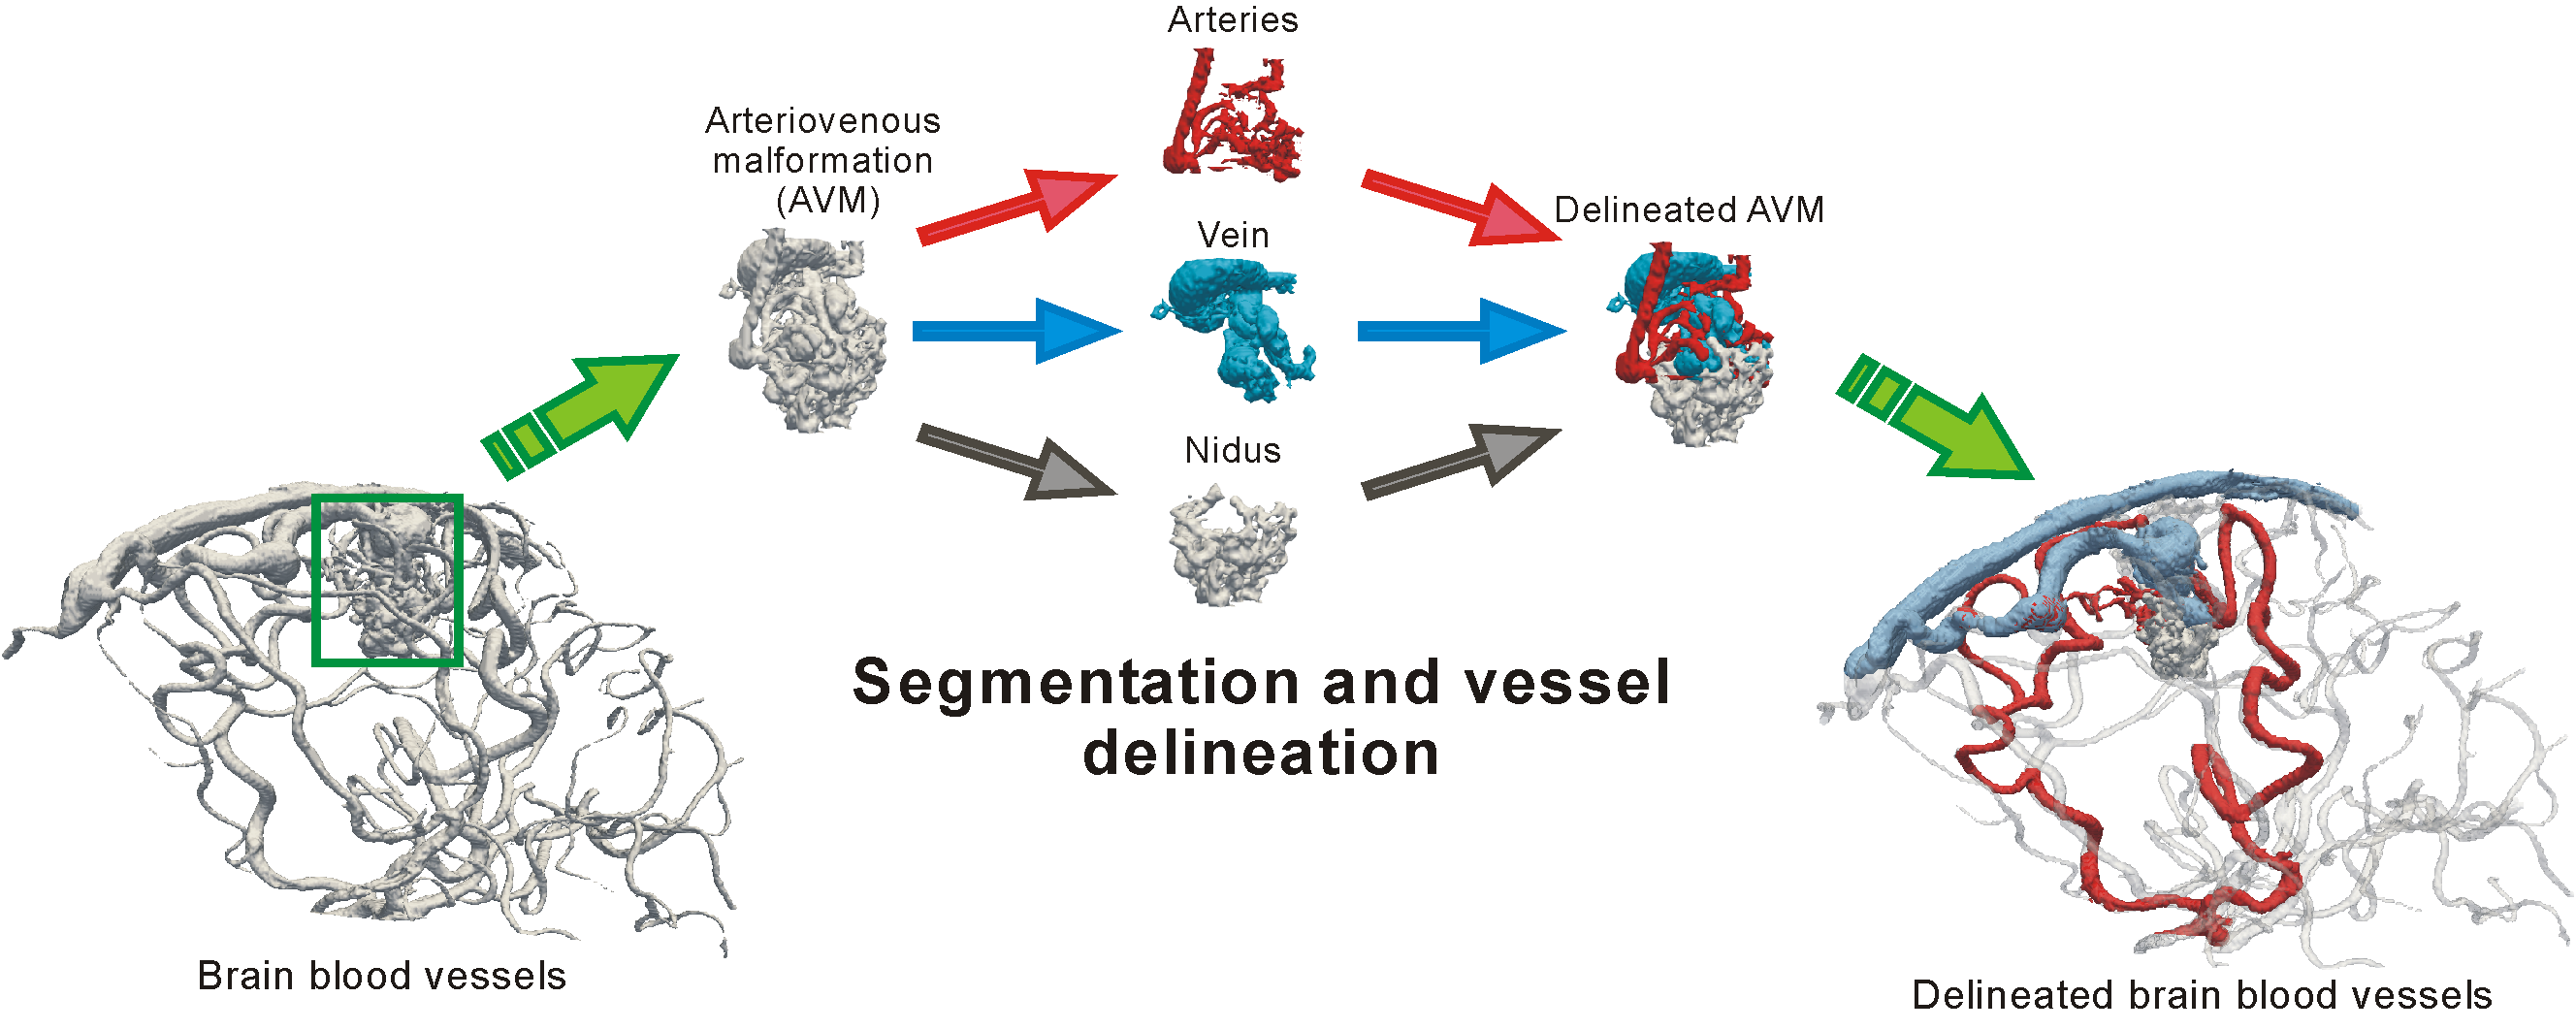
Generalized profiling with application to arteriovenous malformation segmentation
The segmentation of cerebral blood vessels is of great importance in diagnostic and clinical applications, with a special application in diagnostics and surgery on arteriovenous malformations (AVM). Our method of generalized pixel profiling addresses the problem of the AVM inner structure segmentation. In combination with skeletonization we use the method to delineate the regions of AVM. The algorithm stands out in situations with low resolution images and high variability of pixel intensity. The method parameters are set automatically, which yields little manual user intervention. Results show an accurate blood vessel structure segmentation with a clear delineation between the most important parts of the AVM, which are the feeding arteries, draining vein and the nidus.
References:
- Babin, D., et al. Generalized pixel profiling and comparative segmentation with application to arteriovenous malformation segmentation. Med. Image Anal. (2012), doi:10.1016/j.media.2012.02.006.
Contact: dr.ir. Danilo Babin
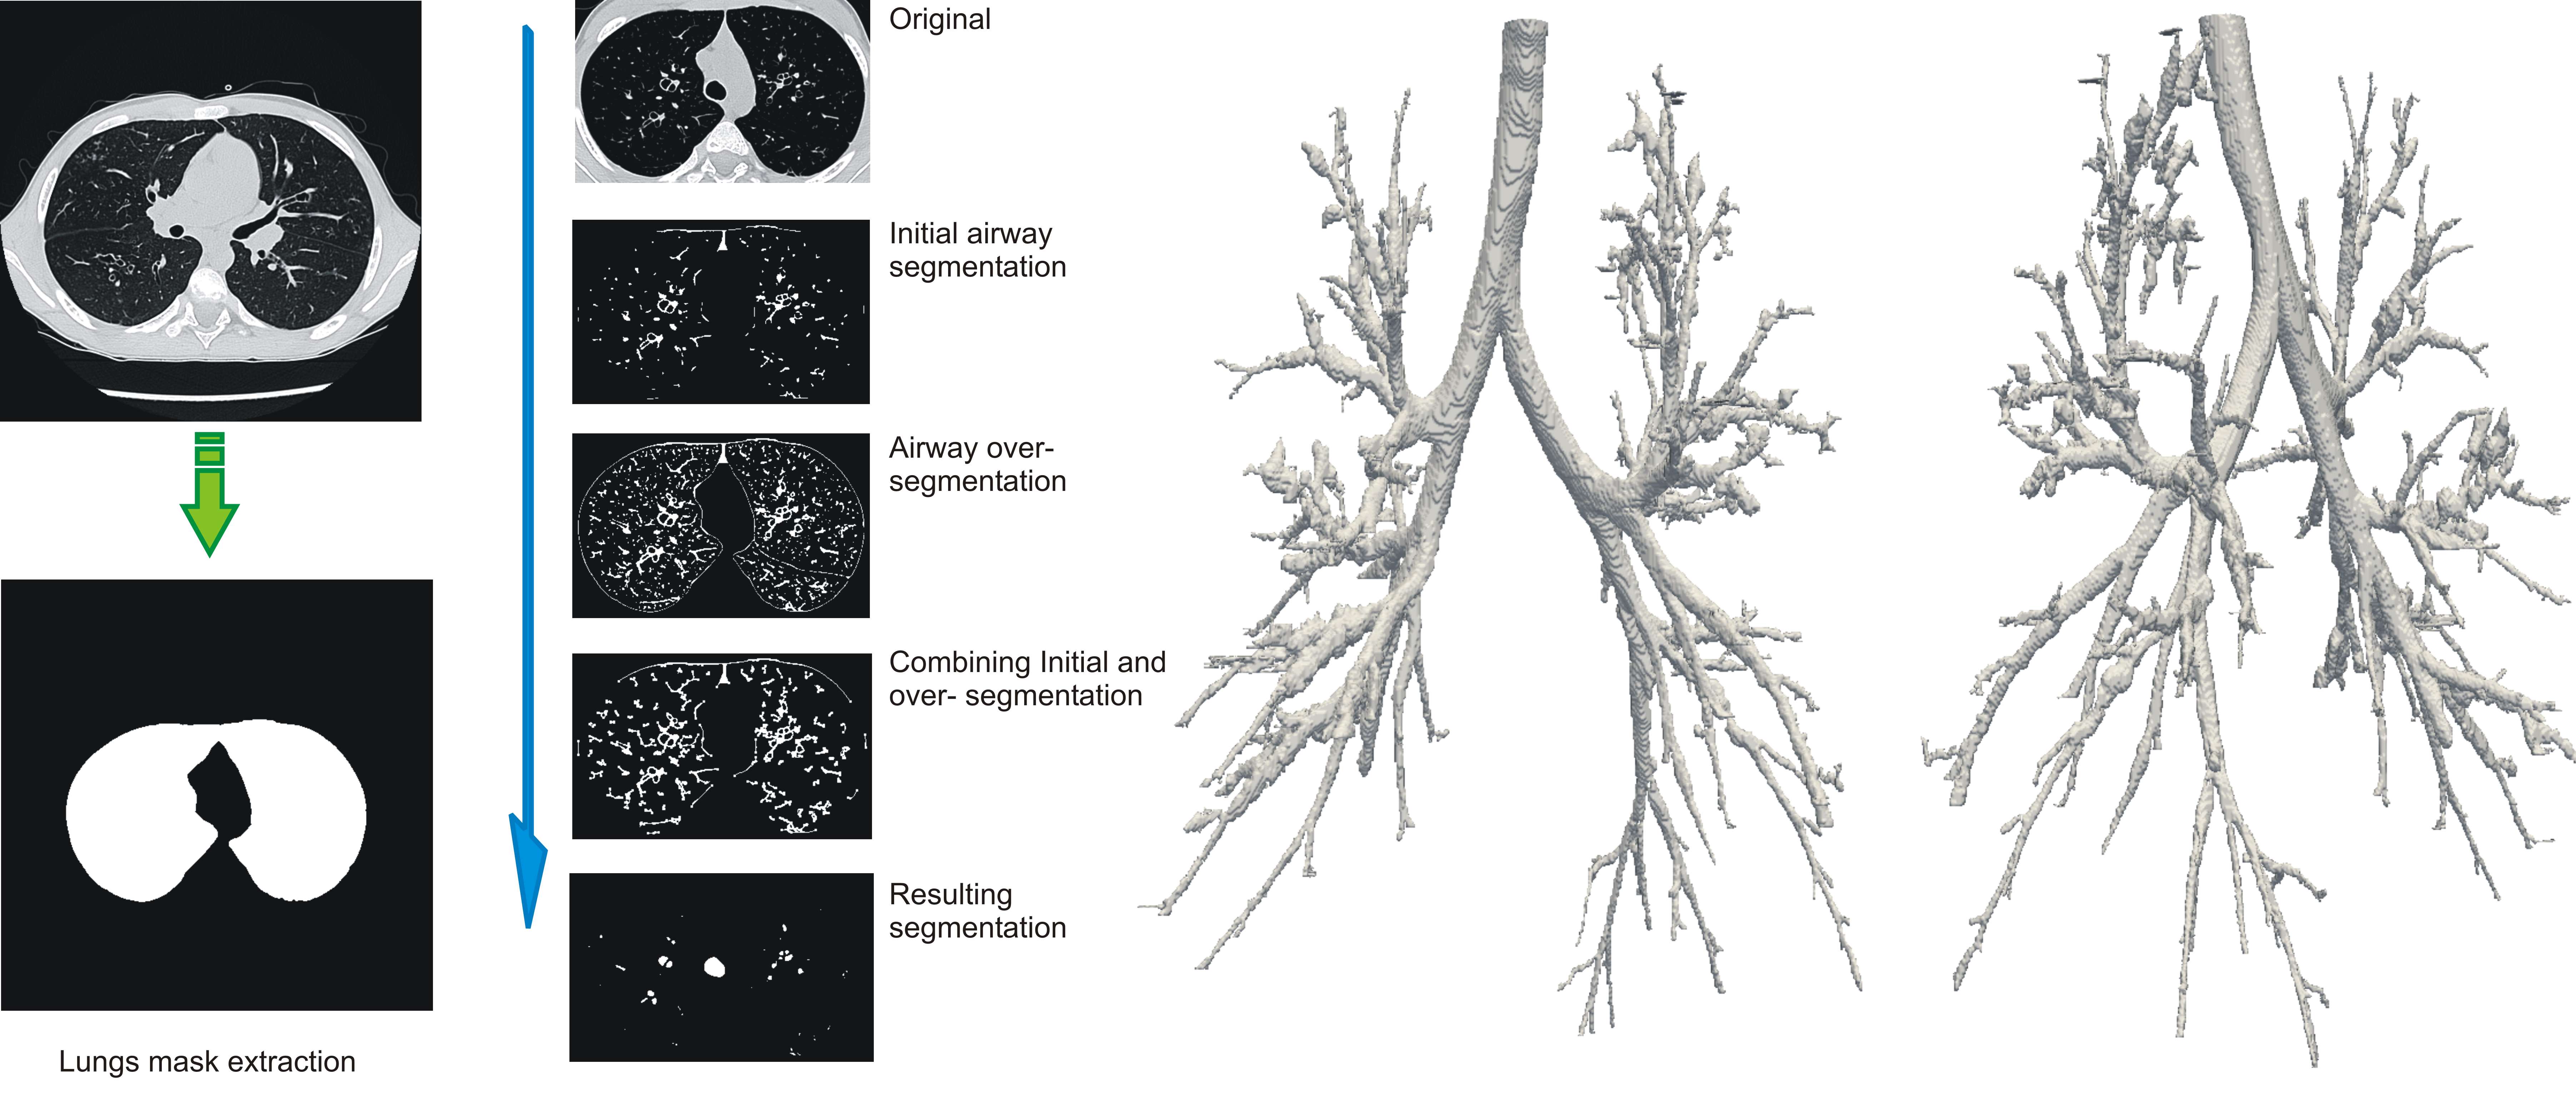
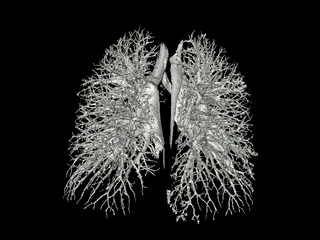
Segmentation of lung airways
Many lung pathologies can be diagnosed based on the structure and shape of the airway tree, as well as by measurements of distances and radii of airways. Because of this the accurate segmentation of CT images of lung airways plays an important role in diagnostics and treatment of such diseases. Our approach is an edge-detecting slice-by-slice segmentation method, capable of segmenting low contrasted airway regions. The segmentation using projections method shows robustness in images with high presence of noise.
References:
- Babin, D. et al. Segmentation Segmentation of airways in lungs using projections in 3-D CT angiography images. EMBC (32) Proceedings, 3162-3165, 2010.
Contact: dr.ir. Danilo Babin
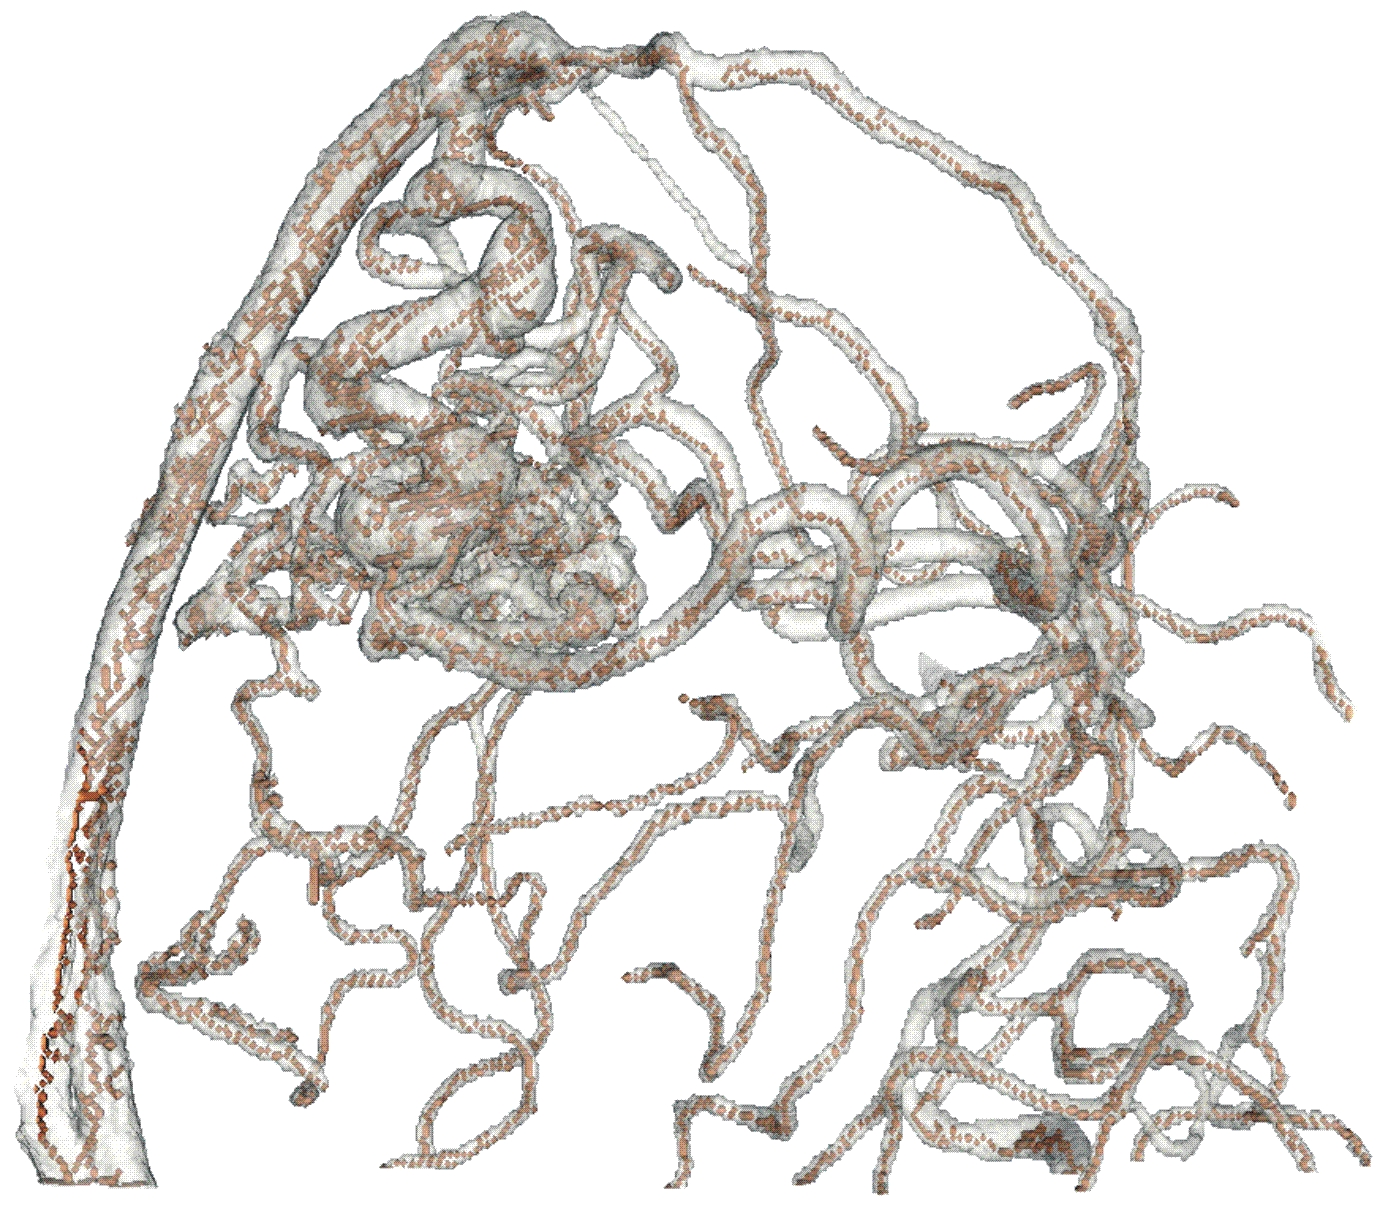
Skeletonization for best path calculation in 3-D MRI images of blood vessels
Introduction of a novel method for skeleton image construction for 2-D and 3-D images, which accurately represents morphological characteristics of the segmented image, enables us to take into account the shape of the blood vessels and to recognize all relevant segments. By constructing a graph from the skeleton image and applying shortest path algorithm, we obtain the best path estimation in segmented MRI brain blood vessel images, which is applicable to other 3-D MRI images.
Contact: dr.ir. Danilo Babin
Fast and memory-efficient 3D segmentation and morphology
By dropping the conventional label volume to code the region information by a novel line segment based data structure we were able to develop a fast and memory efficient 3D segmentation and morphology framework. Reduction in memory usage: up to factor 50 3D segmentation speed: up to 260 MVoxels/s 3D morphology speed: up to 770 MVoxels/s
Contact: dr.ir. Danilo Babin
Focal Cortical Dysplasia (FCD) Detection in MR
Focal cortical dysplasia (FCD) is a frequent cause of epilepsy and can be detected using brain magnetic resonance imaging (MRI). In clinical treatments, FCD lesions are often removed by resective surgery. However, some FCD cases still remain undetected because of the subtlety of FCD malformations, complex convolutions of the human cerebral cortex and the partial volume effect in the imaging process. Our method called iterating local searches on neighborhood (ILSN) quantitatively measure the Gray-White matter Boundary (GWB) width.Since GWB corresponding to a FCD lesion is wider than the healthy GWB, the regions with the increased GWB width represent possible FCD lesions.
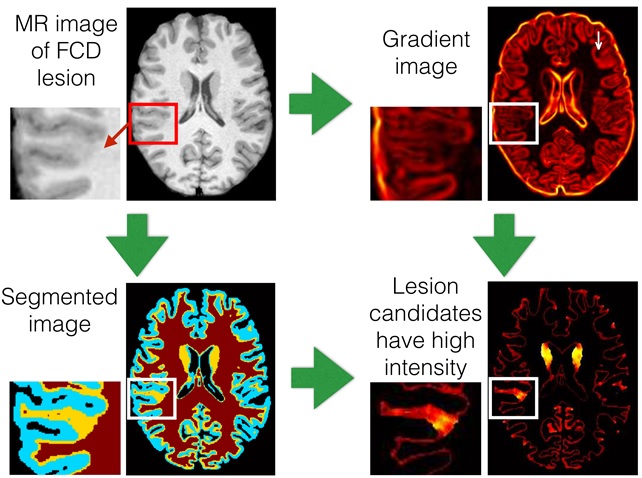
Figure 1: FCD detection in MRI images
References:
- X. Qu, L. Platisa, I. Despotovic, A. Kumcu, T. Bai, K. Deblaere, W. Philips, "Estimating Blur at the Brain Gray-White Matter Boundary for FCD Detection in MRI", In The 36th Annual International Conference of the IEEE Engineering in Medicine and Biology Society (EMBC), no. 333, Chicago,USA, pp. 3321 - 3324, 2014.
Contact: ir. Asli Kumcu
Diffusion MRI data analysis and processing
The aim of this research is to improve the quality of estimates obtained from diffusion MR images, with the goal of investigating human brain features in a more reliable and reproducible way. Our group has so far focused on the analysis of Gibbs ringing effect and its reduction. Moreover, diffusion MRI phantom data of brain-like complexity have been produced and made publicly available to other researchers in a form that is suitable for scientific analysis.
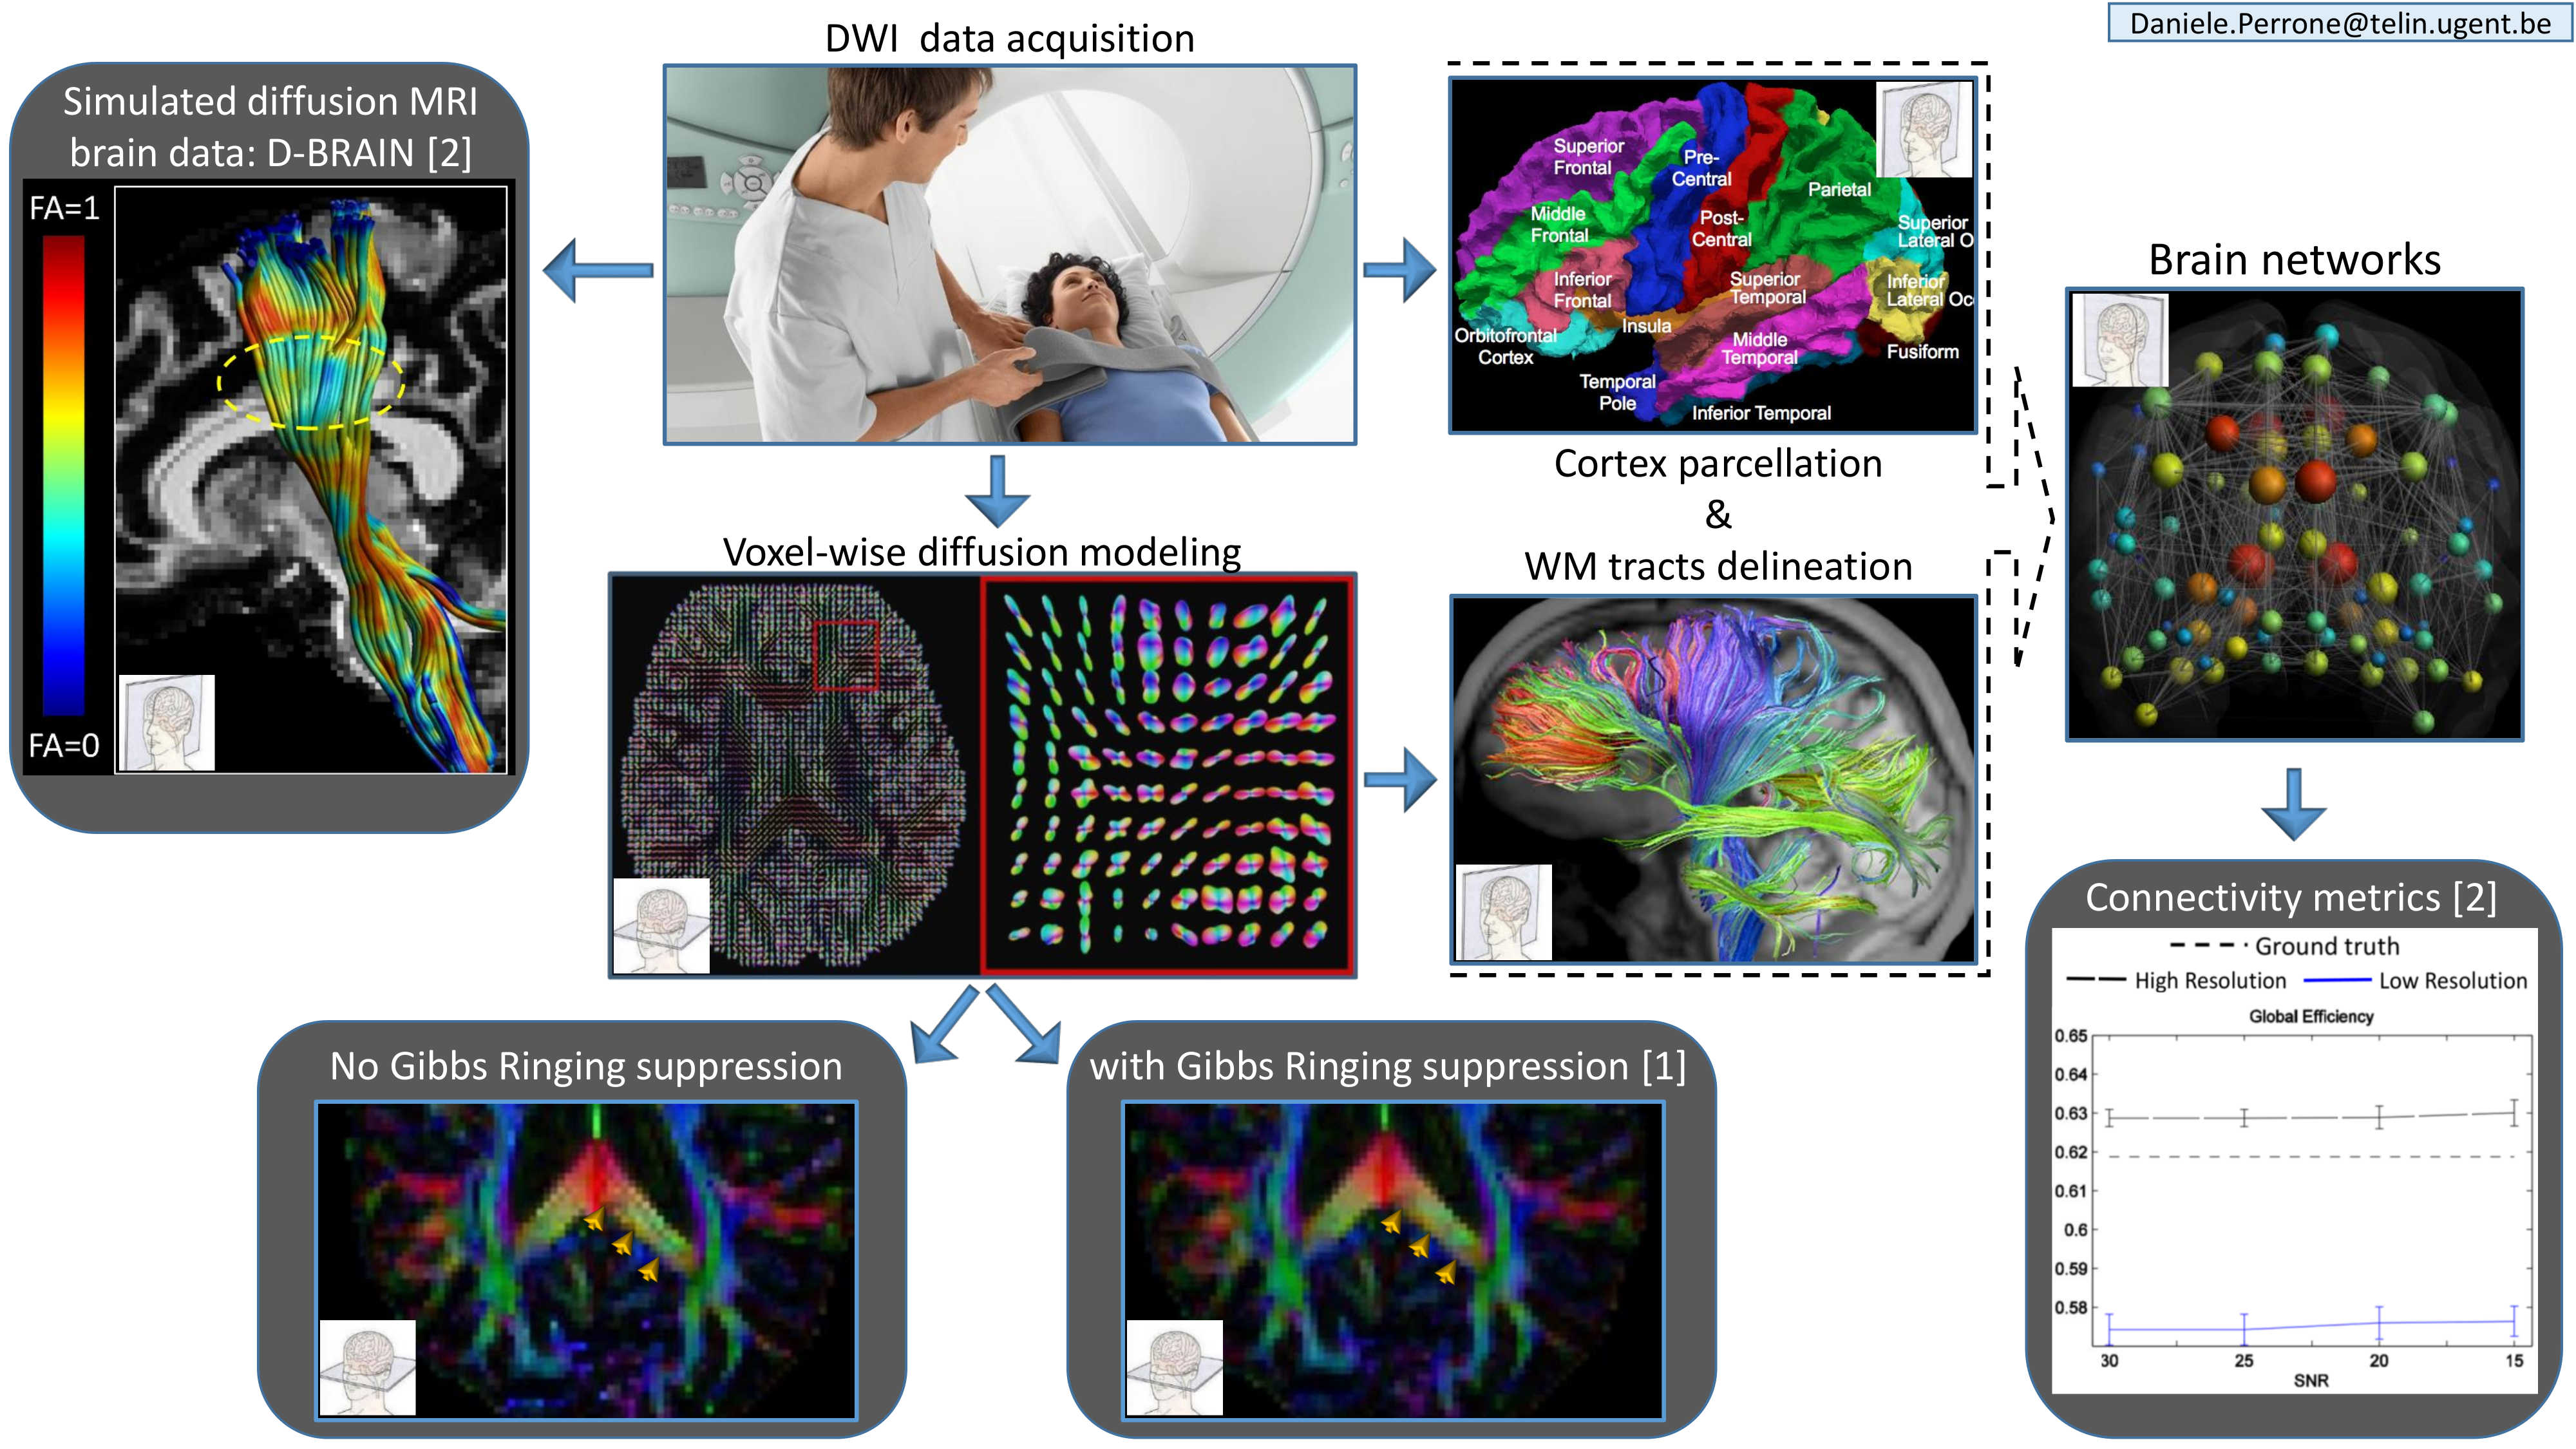
Figure 1: Generation and analysis of digital tractography images.
References:
- The effect of Gibbs ringing artifacts on measures derived from diffusion MRI, 2015, NeuroImage D-BRAIN: anatomically accurate simulated diffusion MRI data, 2016, PLOS ONE
Contact: dr. ir. Jan Aelterman
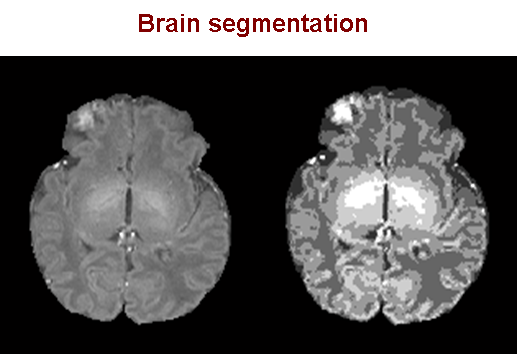
MRI segmentation of the developing newborn brain
The main goal of this project is development of automatic and robust algorithm for MRI segmentation of different head structures in newborn infants. The accurate segmentation results play a crucial role in three-dimensional (3-D) volume visualization and allow us to measure the growth, to explore developmental changes and to detect early disorders of different anatomical structures for both scientific and clinical investigations. However, MRI brain segmentation is more complex and challenging task for developing neonates than adults, mainly due to the fast growth process and the biology.
 |  |
Contact: dr.ir. Danilo Babin
Parallel MRI+compressive sensing
Image formation of an MRI image consists of many steps. We do active research in many of those steps ranging from image acquisition to post processing.
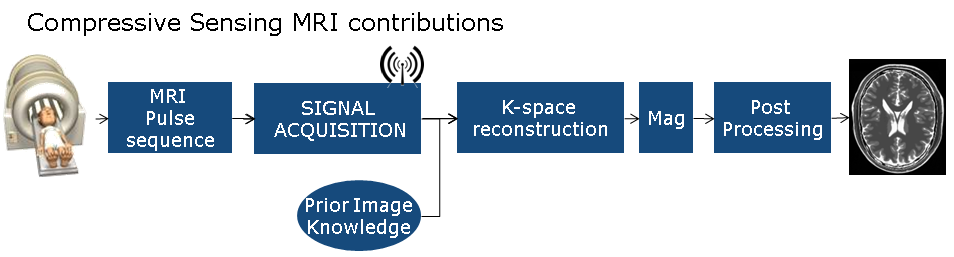
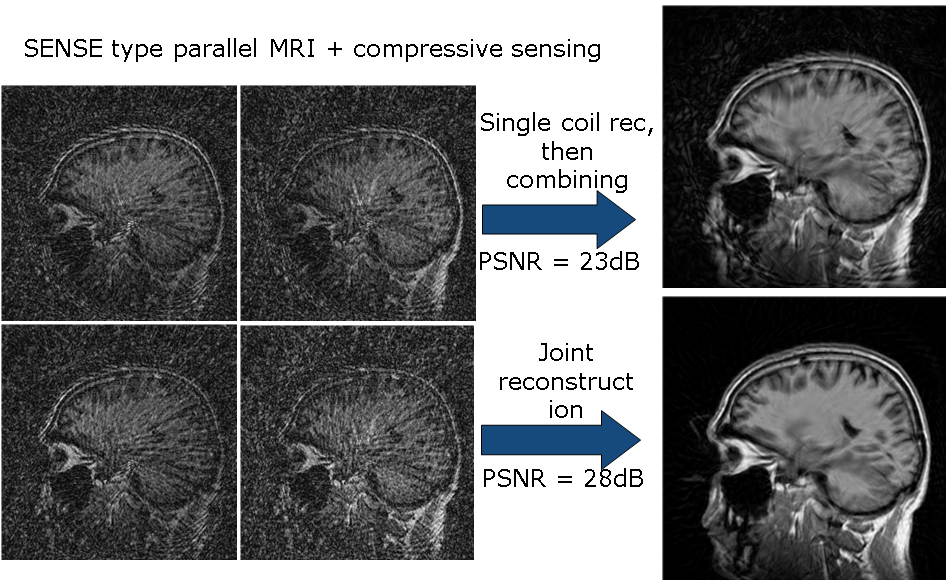
Similar to compressive sensing, parallel imaging is an MRI acquisition technique that allows to accelerate by skipping parts of the planned image spectrum. Instead of using prior models to fill in missing data however, multiple receiving antennas are used within the MRI system (instead of just one). This allows the missing data to be reconstructed as the a well-posed inversion of a linear system. That makes pMRI and CS complementary techniques that can be used jointly to great mutual benefit. The image shows a comparison between the reconstruction from 4 coils separately, the reconstruction from 4 coils jointly using just pMRI and CS separatly, and the reconstruction from 4 coils jointly using pMRI and CS jointly, using the COMPASS technique.
References:
- J. Aelterman, H. Luong, B. Goossens, A. Pižurica, W. Philips, "COMPASS: A joint framework for parallel imaging and compressive sensing in MRI", Proc. of International Conference on Image Processing (ICIP) 2010, pp. 1653 -- 1656, Hong Kong.
Contact: dr.ir. Jan Aelterman
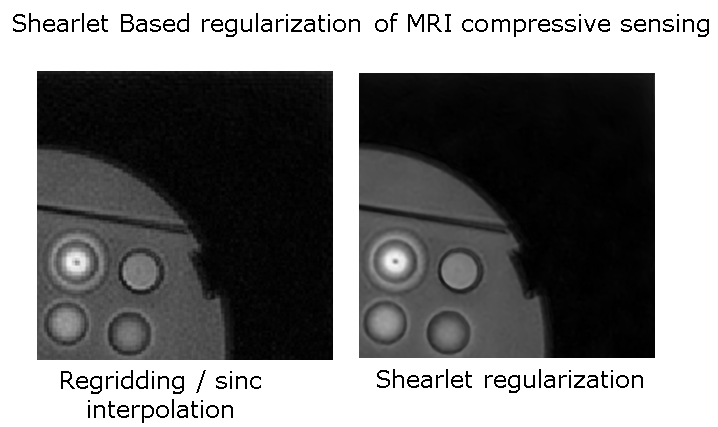
Shearlet regularization for compressive sensing MRI
Compressive sensing is a promising technique that allows to drastically reduce the acquisition time of an MRI sequence by carefully skipping some parts of the planned image spectrum during acquisition. Powerful prior image models are then used to help in reconstructing missing data. Our technique stands out in the use of shearlets, which are optimally able to represent many types of natural images with smooth curves.
References:
J. Aelterman, B. Goossens, A. Pižurica, and W. Philips, "Augmented Lagrangian based reconstruction of non-uniformly sub-Nyquist sampled MRI data," Elsevier Signal Processing, vol. 91, no. 12, pp. 2731-2742, 2011.
B. Goossens, J. Aelterman, H. Luong, A. Pižurica and W. Philips, "Design of a tight frame of 2D shearlets based on a fast non-iterative analysis and synthesis algorithm," SPIE Int'l Conf Wavelets and Sparsity XIV, Aug 21-25, 2011, San Diego, CA, USA (Invited Paper).
Contact: dr.ir. Jan Aelterman
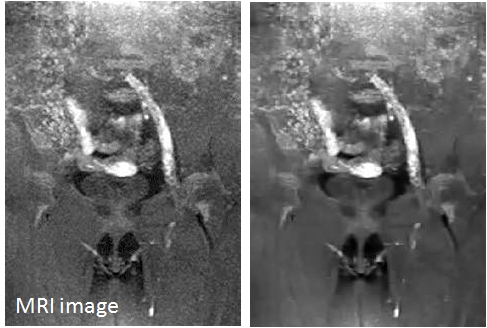
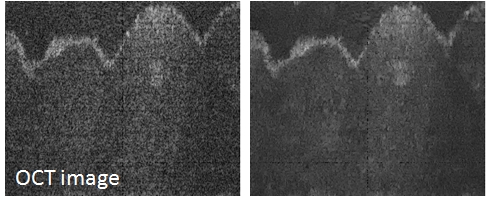
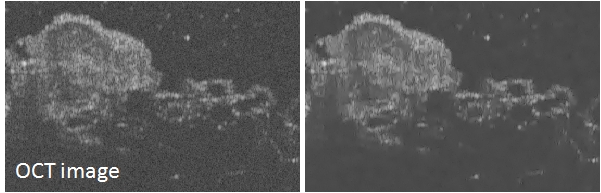
Denoising of medical images
Multiresolution algorithms for denoising signal dependent noise in Magnetic Resonance Images (MRI), Optical Coherence Tomography (OCT)images, ultrasound images and low-dose X-Ray CT images. The result of denoising an example MRI image is shown below. For examples of denoising OCT images, click here or here.
References:
A. Pizurica, LJ. Jovanov, B. Huysmans, V.Zlokolica, P. De Keyser, F. Dhaenens and W. Philips, "Multiresolution Denoising for Optical Coherence Tomography: A Review and Evaluation", Current Medical Imaging Reviews
J. Aelterman, B. Goossens, A. Pizurica and W. Philips, "Removal of Correlated Rician Noise in Magnetic Resonance Imaging," in Proc. 16th European Signal Processing Conference (EUSIPCO), Lausanne, Switzerland, Aug 25-29 2008.
B. Goossens, J. De Bock, A. Pizurica, W. Philips, "Low-Dose CT Image Denoising By Locally Adaptive Wavelet Domain Estimation," in Proc. IEEE Benelux Chapter on Engineering in Medicine and Biology (EMBS), 6-7 Dec 2007, Heeze, the Netherlands.
A. Pizurica, A. M. Wink, E. Vansteenkiste, W. Philips and J.B.T.M. Roerdink "A review of wavelet denoising in MRI and ultrasound brain imaging", Current Medical Imaging Reviews, vol. 2, no. 2, 247-260, 2006
A. Pizurica, W. Philips, I. Lemahieu and M. Acheroy, " A Versatile Wavelet Domain Noise Filtration Technique for Medical Imaging", IEEE Transactions on Medical Imaging, vol. 22, no. 3, pp. 323-331, March 2003.
Contact: prof. dr. ir. Aleksandra Pizurica
Medical image and video quality assessment
Why do we want to measure the level of quality in medical image and video?
Reduced image quality can annoy the users (e.g. compression artifacts like blocking or blurring; discomfort in stereoscopic viewing) Reduced image quality can hinder clinical interpretation of the images (e.g. reduce doctors' ability to detect cancers) What can we do once we can measure quality? What are our Goals?
We can use the quality measurements to guide the design of new imaging systems or algorithms with better quality We can objectively compare imaging systems and algorithms For video, we can use the quality measurements to adjust the parameters of image acquisition/transmission in real-time In the IPI group, we approach the quality assessment problem from two angles:
Perceived image quality: Measure subjective image quality on images/video affected by acquisition impairments, compression, or image/video display Image utility: Measure the utility of the images for a specific task such as detecting lung cancers chest x-ray images (for example to compare a medical versus a consumer display, or the results of different reconstruction or denoising algorithms) To measure perceived image quality and image utility, we have been using human studies as well as (task-based) image quality measures, those from the literature as well as those developed by IPI.
Our work in medical image and video quality assessment (QA) covers the following topics:
Subjective QA in medical imaging
Task-based QA using numerical model observers
Task-based QA for interventional X-ray sequences
DICOM calibration of medical stereoscopic displays
Video latency in laparoscopic surgery See also our work on general video and image quality assessment here.
Contact: ir. Asli Kumcu, dr. ir. Ljiljana Platisa, Prof. dr. ir. Bart Goossens
Task-based QA using numerical model observers
Today, numerical model observers are increasingly used to assist or substitute medical specialists in evaluating the quality of medical imaging systems. In particular, the channelized Hotelling observer (CHO) model is recognized to approximate reasonably well human observer performance in the diagnostic task of lesion (signal) detection. The model relies on the property of the human visual system to process visual information through frequency selective channels. However, optimizing images in terms of signal detectability alone still allows a lot of freedom in terms of imaging parameters such as blur, noise, and contrast. We have proposed the channelized joint observer (CJO) model capable of estimating the signal blur, noise and contrast together with the signal detectability, within the same space, as shown in Figure 1. Our method is primarily intended to aid medical image reconstruction techniques and medical display design, although the technique can also be useful in a much wider context.
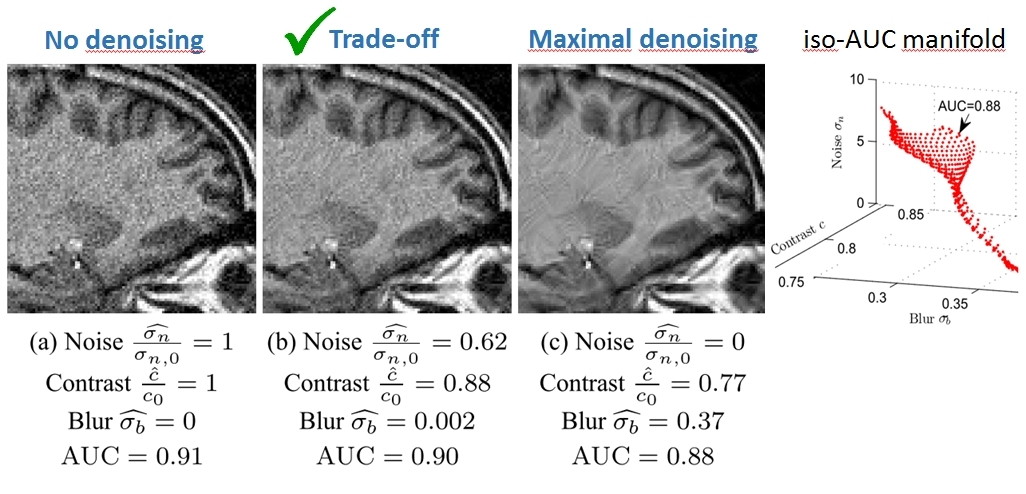
Figure 1. Optimization of denoising of brain MRI images, in terms of imaging parameters such as blur, noise, and contrast, for the same level of signal detectability (AUC). Images (a) and (c) show the image with no and maximal denoising; image (c) has an intermediate level of denoising which induces slightly higher blur and lower contrast compared to (a), but this is offset by lower noise. The trade-off between noise, contrast, and blur parameters versus AUC is shown on the right-most plot.
Furthermore, following the trends of rapidly emerging 3D imaging technologies in current clinical practice, we have proposed several multi-slice CHO (msCHO) designs inspired by the postulates about how humans view volumetric image data sets while using sequence-browsing image presentation. These models have been used in the context of task-based quality evaluation of medical display systems, as illustrated in Figures 2 and 3. At the same time, we have conducted multiple experiments with human observers, in which observers detected signals while browsing volumetric image sequences, in order to help guide future improvements towards msCHO models that could better predict human performance.
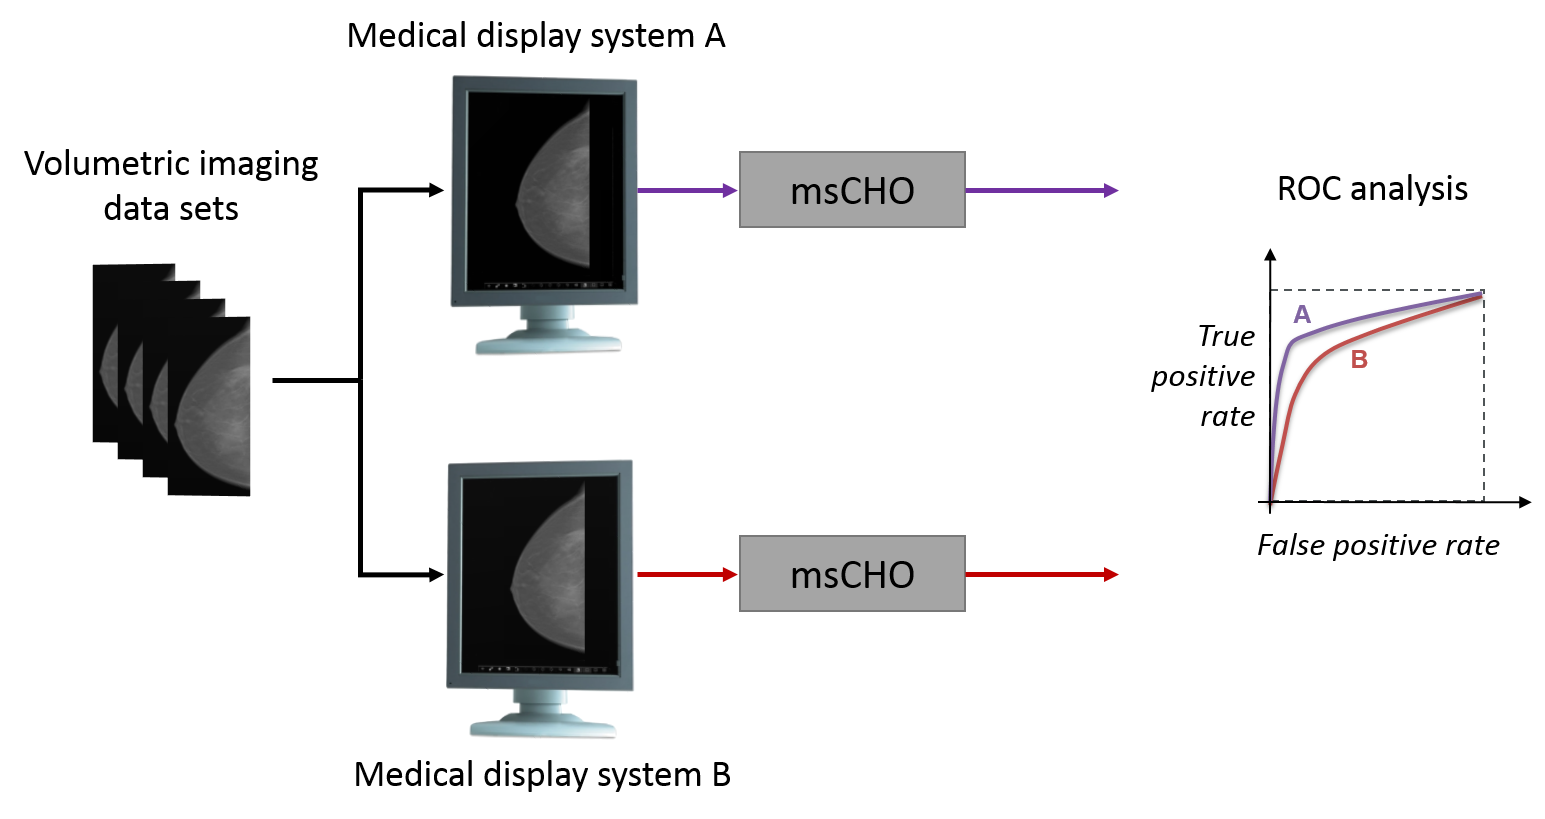
Figure 2. Proposed msCHO model used in pre-clinical validation of medical LCD systems: Predicted performance in lesion detection is higher for the display system A compared to the system B (in the plot, the Area Under the ROC curve (AUC) of the display system A is larger than that of the display system B).
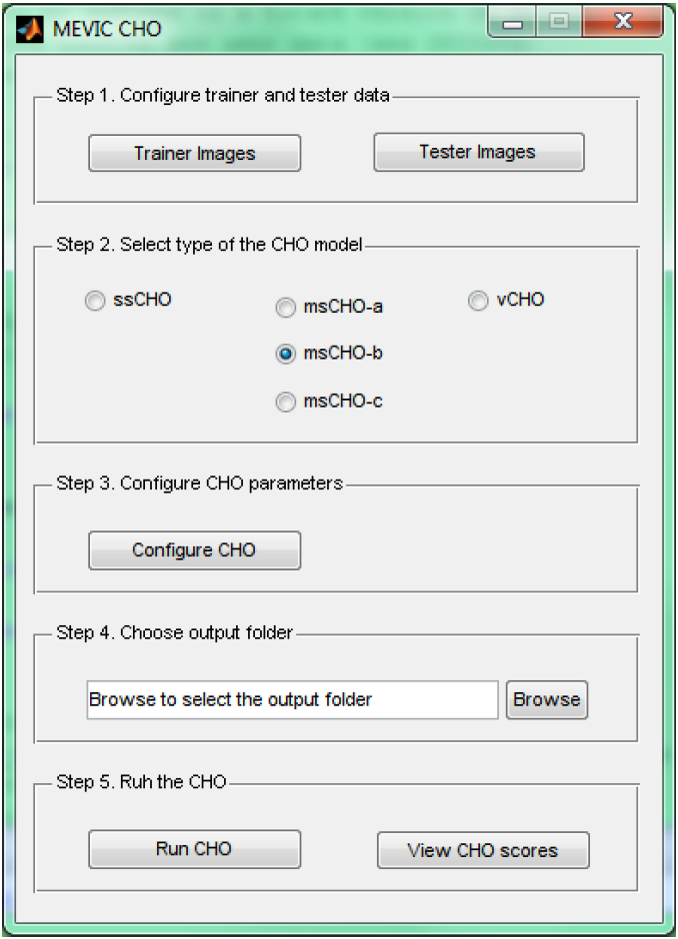
Figure 3. Running model observer experiments
References:
L. Platisa, B. Goossens, E. Vansteenkiste, S. Park, B. Gallas, A. Badano, and W. Philips, "Channelized Hotelling Observers for the Assessment of Volumetric Imaging Data Sets." Journal of the Optical Society of America A-Optics Image Science and Vision 28 (6): 1145-1163, Jun 2011. [bib]
L. Platisa, A. Kumcu, M. Platisa, E. Vansteenkiste, K. Deblaere, A. Badano, W. Philips, "Volumetric detection tasks with varying complexity: human observer performance", in Proc. SPIE Medical Imaging 2012: Image Perception, Observer Performance, and Technology Assessment. [bib]
B. Goossens, H. Luong, L. Platisa, W. Philips, "Objectively Measuring Signal Detectability, Contrast, Blur and Noise in Medical Images using Channelized Joint Observers", In SPIE Medical Imaging, Orlando, Florida, USA, 2013. [bib]
Contact: dr. ir. Ljiljana Platisa, Prof. dr. ir. Bart Goossens
Task-based QA for interventional X-ray sequences
Classical estimates of diagnostic performance - model observers - typically test subtle signals at threshold contrast perception. This approach may not be suitable for real-time quality assessment of medical imaging systems in which observers operate at suprathreshold contrast levels, such as interventional X-ray. Automatic dose control mechanisms for these systems adjust patient dose based on pre-determined patient thickness/dose curves and measurement of average gray levels in the acquisition, and may overestimate the dose needed to conduct the clinical task on a given patient or region.
We have developed a real-time task-based medical quality measure that aims to estimate the minimum dose needed to obtain suprathreshold contrasts of target objects (vessels). The quality measure is built from two components, shown in Figure 1: (1) a detectability function which models the clinical task of target detection, consisting of a set of psychometric functions that predict the detectability of vessel-like targets in dynamic sequences given a set of image features such as contrast and noise, and (2) an algorithm which measures these features on X-ray sequences. Preliminary results indicate a monotonic relationship between the model and dose and subjective quality preferences of interventional cardiologists. Figure 2 shows the results for a sequence acquired at 100% dose and the same sequence at 50% dose with denoising applied: both the model and doctors indicated equivalent image quality. Further experiments are in progress towards incorporating this measure in a feedback loop for dose reduction while ensuring sufficient image quality for the clinical task.
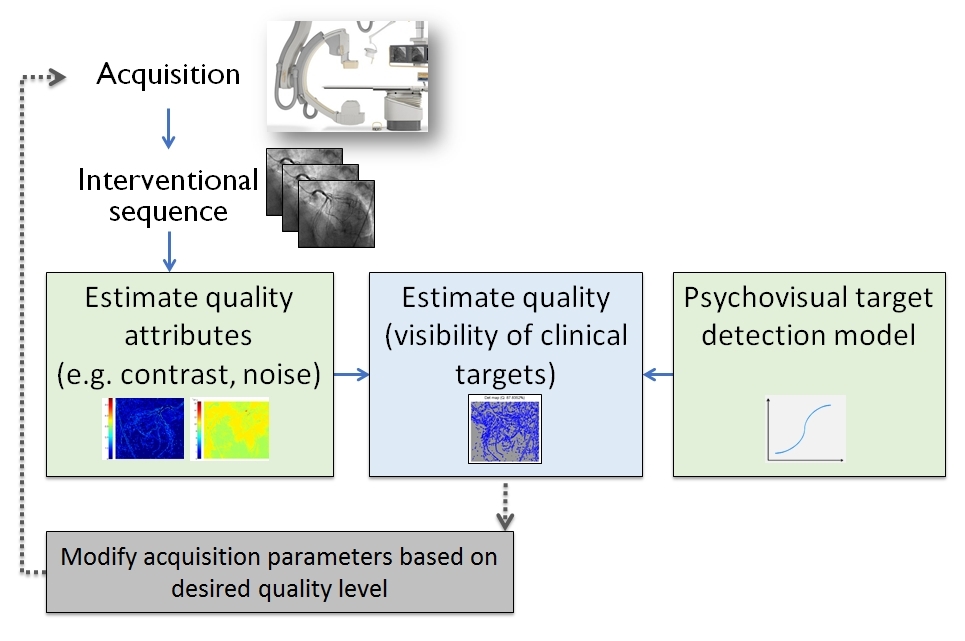
Figure 1: Diagram of task-based quality measure for interventional X-ray. The measure consists of two main components (green boxes): a target detection model (right), and (2) set of algorithms which measure image quality attributes (left).
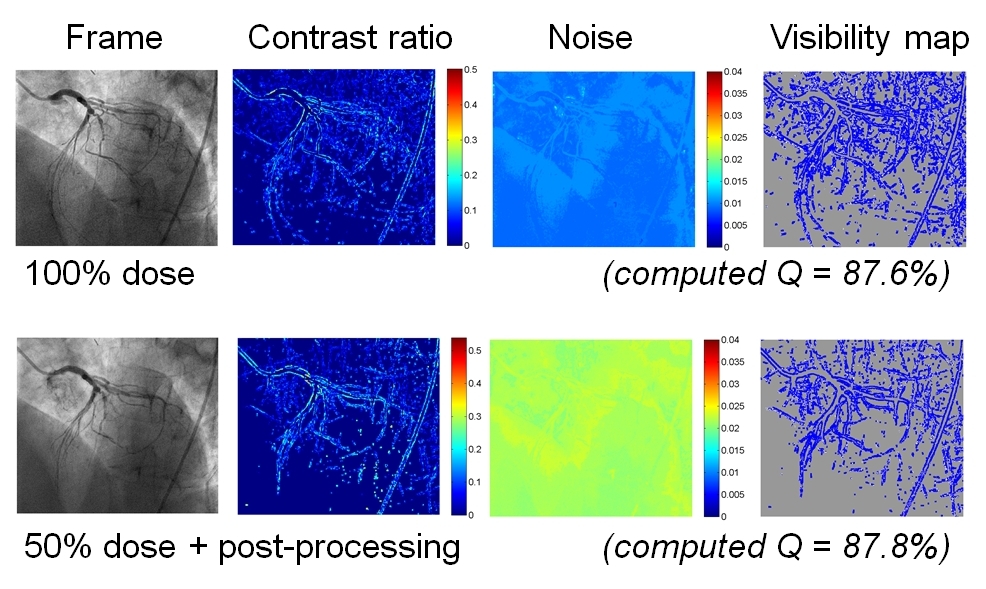
Figure 2: Results for a sequence acquired at 100% dose (top) and the same sequence at 50% dose with denoising applied (bottom row). From left to right: original frame, computed contrast ratio at vessel edges, computed noise variance, and the computed detectability (visibility). Q refers to Quality. Both the algorithm and doctors indicated equivalent image quality.
References:
A. Kumcu, B. Ortiz-Jaramillo, L. Platisa, B. Goossens, W. Philips, "Interventional X-ray quality measure based on a psychovisual detectability model", In Medical Image Perception Conference XVI, Ghent, Belgium, June 3-5, 2015. [bib]
A. Kumcu, L. Platisa, W. Philips, "Effects of static and dynamic image noise and background luminance on letter contrast threshold", In 7th International Workshop on Quality of Multimedia Experience (QoMEX 2015), pp. 1-2, 2015. [bib]
Contact: ir. Asli Kumcu
DICOM calibration of medical stereoscopic displays
Medical, especially diagnostic, displays require rigorous luminance calibration. While DICOM calibration based on the grayscale display function (GSDF) is the accepted calibration procedure for 2D medical displays, there is no standard procedure for 3D displays. The 2D GSDF was generated from the 2D contrast sensitivity function (CSF): the sensitivity of the human eye to changes in contrast. Therefore, we conducted an experiment to measure the 3D CSF (see Figure 1) in order to determine whether the existing 2D GSDF and therefore the 2D DICOM calibration procedure would be suitable for 3D displays. Our preliminary findings indicate that for stereoscopic polarized displays, under stereoscopic visualization conditions within the zone of clear single binocular vision, 2D DICOM calibration remains valid for 3D visualization.
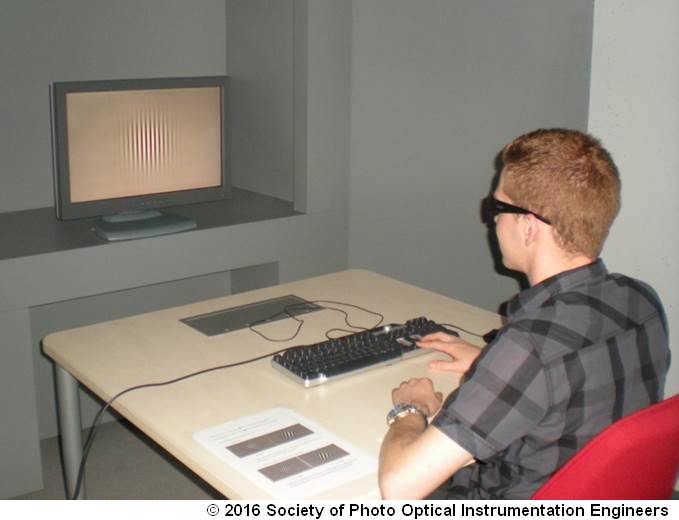
Figure 1: Example of experiment setup for assessment of the 3D CSF with Gabor patches.
References:
- J. Rousson, J. Haar, S. Santal, A. Kumcu, L. Platisa, B. Piepers, T. Kimpe, W. Philips, "Contrast sensitivity function in stereoscopic viewing of Gabor patches on a medical polarized 3D stereoscopic display", In Journal of Electronic Imaging, vol. 25, no. 2, pp. 023014-1-15, 2016. [bib]
Contact: dr. ir. Ljiljana Platisa
Subjective QA in medical imaging
While subjective QA is not a replacement for diagnostic studies in medical imaging, as it does not measure how useful an image is at doing its job, it can still be used to understand the relationship between imaging parameters and the user's perception/experience, or for finding thresholds at which differences become perceptible. (See also our related work in General video and image quality assessment). However, it is important to realize that subjective preference may not necessarily correlate directly with diagnostic performance, as evidenced by our study of digital pathology image data which considered both the subjective QA and the task performance-based QA - this is a topic for future research.
We have conducted several subjective evaluation studies for medical images and video. Figure 1 shows the results from a QA study on the perceived quality of H.264/AVC (optimized for low latency) compressed laparoscopic surgery video. Experiments were conducted for two expertise groups (surgeons and imaging experts) using two camera types. Quality was measured using three image quality metrics -- VQM, HDR-VDP-2, and PSNR -- of which VQM was content/camera-independent.
[VQM] Pinson and Wolf, A new standardized method for objectively measuring video quality, IEEE Trans. Broadcast., 2004;
[HDR-VDP-2] Mantiuk et al, "HDR-VDP-2: A calibrated visual metric for visibility and quality predictions in all luminance conditions," ACM Trans. Graphics, 2011
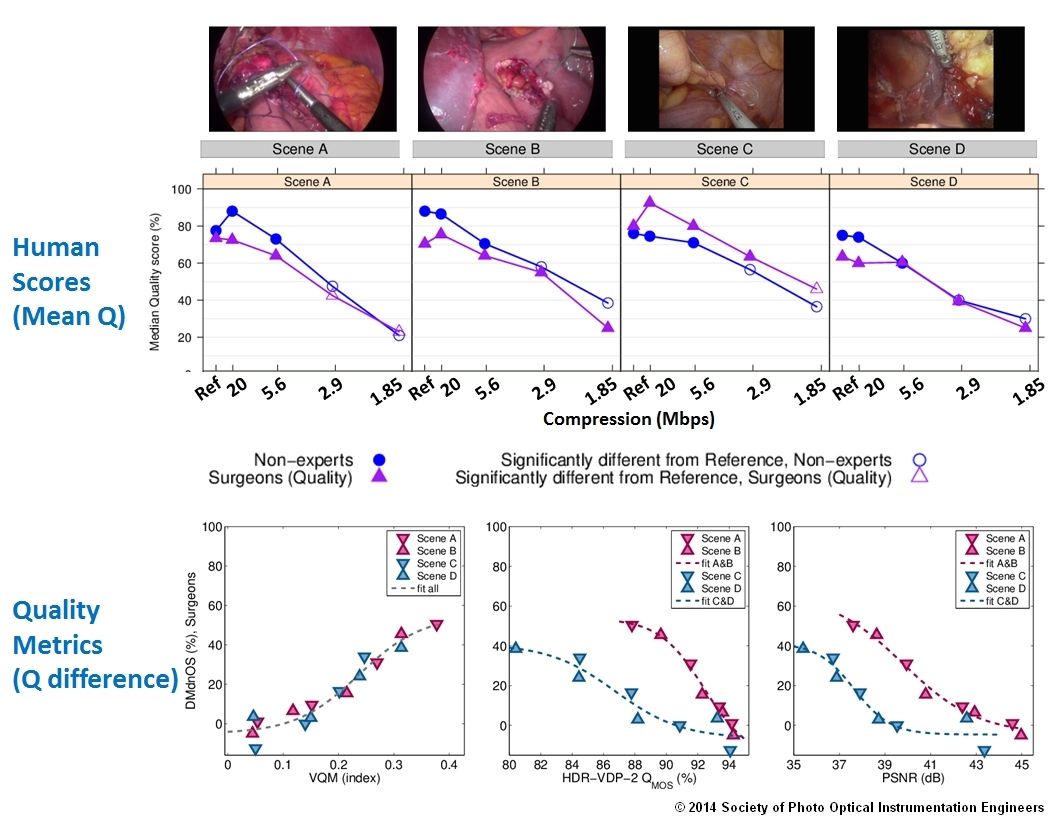
Figure 1: QA study on the perceived quality of H.264/AVC (optimized for low latency) compressed laparoscopic surgery video. Human results (top row) and correlation of quality metrics with human scores (bottom row). Up to 5.6 to 2.9 Mbps was considered equivalent to the uncompressed sequence. Only the VQM metric was camera/content-independent.
We also explored the relationship between perceived image quality (IQ) and perceived depth (PD) in stereoscopic medical images using volume-rendered images for both dual- and single-view distortions. DP was robust to luminance, contrast and brightness alterations and insensitive to noise distortions whereas IQ was sensitive to all distortions. For both DP and IQ, scores for dual-view distortions were significantly worse than those for single-view distortions for multiple blur levels and crosstalk impairments.
References:
A. Kumcu, K. Bombeke, H. Chen, L. Jovanov, L. Platisa, H. Luong, J. Van Looy, Y. Van Nieuwenhove, P. Schelkens, W. Philips, "Visual quality assessment of H.264/AVC compressed laparoscopic video", In Proc. SPIE Medical Imaging, vol. 9037, pp. 90370A-90370A-12, 2014. [bib]
J. Rousson, J. Couturou, A. Vetsuypens, L. Platisa, A. Kumcu, T. Kimpe, W. Philips, "Subjective quality and depth assessment in stereoscopic viewing of volume-rendered medical images", In Proc. SPIE IS&T Electronic Imaging Stereoscopic Displays and Applications XXV, vol. 9011, pp. 90110E-90110E-13, 2014. [bib]
L. Platisa, L. Van Brantegem, A. Kumcu, R. Ducatelle, W. Philips, "Influence of study design on digital pathology image quality evaluation: the need to define a clinical task," Journal of Medical Imaging (in review)
Contact: ir. Asli Kumcu
Video latency in laparoscopic surgery
Video lag or latency is the delay between an action and the display of the action on a monitor in real-time. Latency may be introduced during video acquisition, post-processing, compression, transmission, or visualization. In minimally invasive surgery, where the surgeon views the surgical field via an optical scope and a display, video latency may induce fatigue and disorientation, render surgery impossible to conduct, and compromise patient safety. A typical laparoscopic system might have 45-65 milliseconds (ms) latency, with compression adding an additional 90 ms latency. Additional video processing will increase the latency. Human-computer interaction studies suggest that even 150 ms latency is noticeable and can be disturbing to people. In the medical domain, few studies have explored the impact of latency from the perspective of user experience, such as the surgeon's impression of efficiency or the impact on patient safety. In the operating room, poor usability may increase the surgeon's mental and physical stress, potentially compromising patient safety.
We conducted a study with surgical trainees and surgeons (see Figure 1) to study the effects of video latency on performance and system usability. There was significant deterioration in performance and user experience at 105 ms added latency (160 ms total latency), shown in Figure 2. Surgeons were more negatively affected than trainees. We found that objective measures (time to complete task) insufficiently described the impact of latency therefore standard measures of user experience should be incorporated in studies.
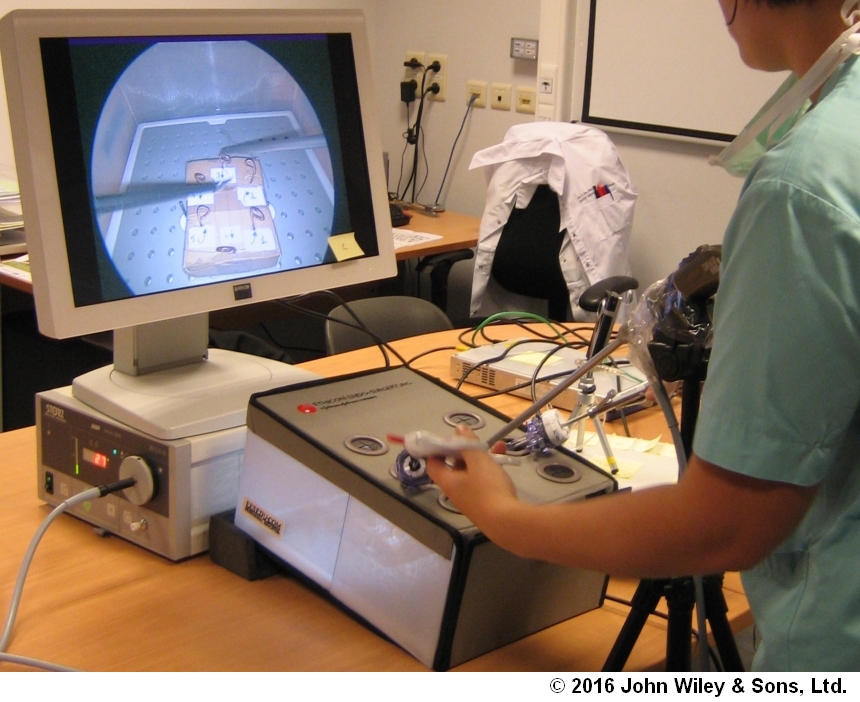
Figure 1: Video latency experimental setup
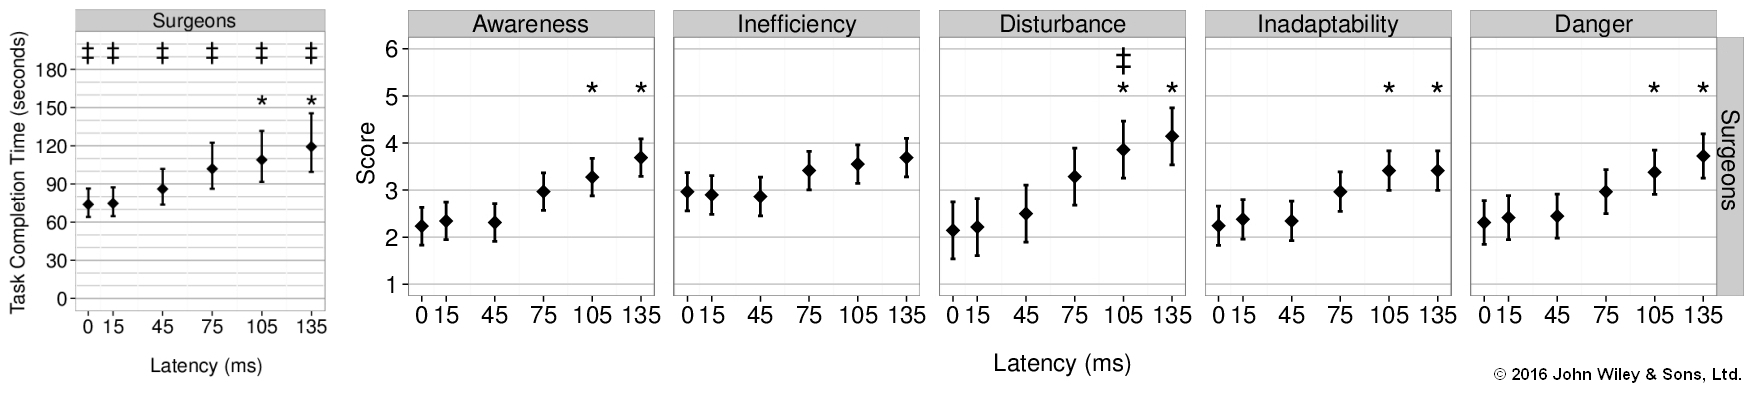
Figure 2: Results for surgeons' time to complete task (left-most plot) and five aspects of Usability for the suture task. We observe that the effects of latency are apparent at 75 ms, with statistically significant effects (indicated by the stars) starting at 105 ms added latency (corresponding to 160 ms total system latency).
References:
- A. Kumcu, L. Vermeulen, S. Elprama, P. Duysburgh, L. Platisa, Y. Van Nieuwenhove, N. Van De Winkel, A. Jacobs, J. Van Looy, W. Philips, "Effect of video lag on laparoscopic surgery: correlation between performance and usability at low latencies", In The International Journal of Medical Robotics and Computer Assisted Surgery, pp. 1-10, 2016. [bib]
Contact: ir. Asli Kumcu
3D Microwave tomography for breast tumor detection
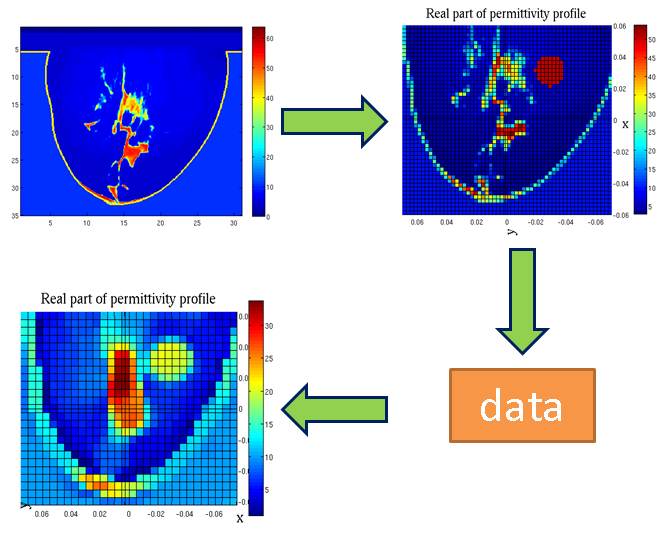
Relatively low cost and the use of low-power non-ionizing radiation indicate the great potential of microwave imaging in preventive health screening. The goal of this research is to develop an efficient and reliable microwave imaging method for breast cancer detection. We demonstrate encouraging preliminary results on the data from the online repository of the University of Wisconsin-Madison (http://uwcem.ece.wisc.edu/home.htm). In simulations, tumor is added artificially in a downsampled image and the microwave frequency is set to 2GHz. The shape of the breast and the overall structure of the inhomogeneities are clearly visible in the reconstruction. The tumor is located correctly and the estimated complex permittivity enables a clear distinction from the healthy tissue.
Contact: dr. ir. Jan Aelterman
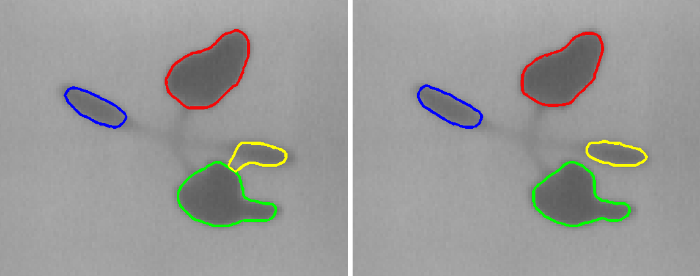
Automatic plant phenotyping using image analysis
Image analysis of Arabidopsis thaliana rosettes is an important non destructive method for studying plant growth. Some work on automatic rosette measurements using image analysis has been proposed in the past, but is generally restricted to be used only in combination with specific high throughput monitoring systems. We investigate new image analysis tools for evaluation of plant shoot phenotypes. These tools are not constrained to one specific monitoring system and can be adapted to different low budget imaging set ups while requiring minimal user input. In contrast to methods described in literature, our methods allow to simultaneously quantify plant growth, photosynthesis and leaf temperature related parameters through the analysis of VIS, chlorophyll fluorescence and/or near infra red time lapse sequences.
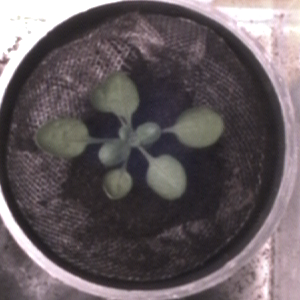 Arabidopsis thaliana in visible light |
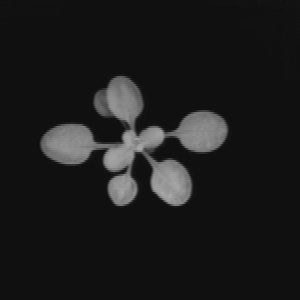 Arabidopsis thaliana chlorophyll fluorescence |
 Segmentation result |
Contact: dr. ir. Jan Aelterman
References: - De Vylder J, Ochoa D, Philips W, Chaerle L, Van Der Straeten D. Tracking Multiple Objects Using Moving Snakes. 2009 16th International Conference on Digital Signal Processing, Vols 1 and 2 2009.
De Vylder J, Ochoa D, Philips W, Chaerle L, Van Der Straeten D. Tracking Multiple Objects Using Intensity-GVF Snakes. 17th European Signal Processing Conference 2009 (EUSIPCO 2009). Glasgow, Scotland; 2009.
De Vylder J., Ochoa-Donoso D., Chaerle L., Van Der Straeten D., Philips W., "Leaf Segmentation and Tracking Using Probabilistic Parametric Active Contours", In Proc. of Mirage 2011, Springer Verlag, 2011.
Estimation of objects' features in biological images
The reliable estimation of objects' features in images is a time consuming task. It demands skilled technicians who spend time identifying and measuring objects of interest in the image. Since we are interested in measuring each object individually, the logical approach is to apply techniques that on the one hand provide accurate segmentation, with minimal human intervention, and on the other reduce the complexity of the tracking process. To achieve this the active contour framework is used and adjusted depending on the problem.
Left: Application of active contour on a thermal image of a sugar beet seedling;
Right:Application of the proposed method
Images are courtesy of Laury Chaerle
References:
J. De Vylder, D. Ochoa Donoso, L. Chaerle, W. Philips, and D. Van Der Straeten, "Tracking multiple objects using moving snakes", Proceedings of 16th International Conference on Digital Signal Processing, 2009
J. De Vylder, D. Ochoa Donoso, L. Chaerle, W. Philips, and D. Van Der Straeten, "Tracking Multiple Objects Using Intensity-GVF Snakes", Proceedings of the 2009 European Signal Processing Conference, 2009
Contact: dr. ir. Jan Aelterman
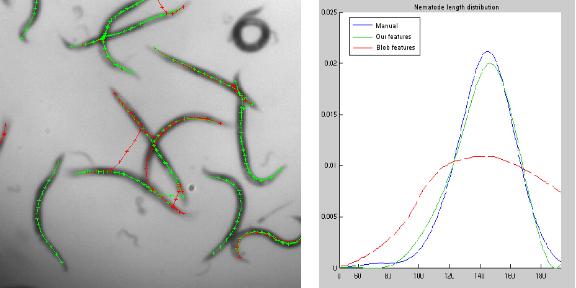
Analysis of high-throughput screening of C. elegans Images
The aim of this research is to extract reliable data from population images in high-throughput screening settings for specimen recognition. This is done by adaptive sampling of the specimen body. By minimizing a energy functional, sampling points are distributed along the specimen body. Then shape data extracted form these sampling points is incorporated into a probabilistic framework for specimen, non-specimen classification. We demonstrate the application of this method for detection of individual nematodes in high-resolution nematode population images. As shown in the figure, this features have better discrimination power than common blob descriptors. In addition, the estimated data fits better the real sample data.
Contact: dr. ir. Jan Aelterman
References:
D. Ochoa, S. Gautama , B. X. Vintimilla, "Contour energy features for recognition of biological specimens in population images", International Conference on Image Analysis and Recognition - ICIAR 2007, pp. 1061-1070, Montreal, Canada, August 2007, Springer LNCS 4633 series, ISBN 978-3-540-74258-6.
D. Ochoa, S. Gautama , B. X. Vintimilla, "Detection of isolated nematodes in clutter environments using shape feature histograms", International Conference on Computer Vision Theory and Applications - VISAPP, Vol.1, pp. 486-491, Portugal, February 2006, ISBN 972-8865-40-6