Video and image quality assessment
Quality assessment (QA) consists of measuring the user's subjective opinion of perceived image/video quality, the user's quality preferences, or the utility of the images for a specific task. The goal of QA is to evaluate and compare imaging systems, and to help drive system design (e.g. sensors, image processing, displays). Image Quality (IQ) is application specific.
For example, optimizing Quality can mean:
Finding the highest amount of compression that results in the smallest visible artifacts (such as blocking or blurring) for a multimedia video compression codec Minimizing perceptual differences between the reference and the output colors of a color-matching algorithm Assessing the effect of LCD temporal response on cancer detection performance
...and each new technology brings new quality trade-offs. We have applied our research to application domains such as broadcast, surveillance, multimedia, and medical, to evaluate technologies such as color correction, camera automation, video denoising, and video compression. In the medical domain, we have investigated image and video quality as related to imaging modalities (X-ray, MRI, digital pathology, laparoscopic video), display temporal response, 3D displays, and video lag [more information on medical QA here]. In addition to technology evaluation, our studies have investigated other aspects such as the influence of image/video content and observer expertise.
QA is typically conducted by running experiments with humans, but this is time-consuming and expensive. Therefore, predictive ("objective") quality metrics can be used to measure artifacts and/or overall quality, and then validated with human experiments. At IPI, we conduct experiments with human studies as well as predictive quality measures, including those from the literature and those developed by IPI.
Below are some examples of our recent QA work:
- Content-aware video quality assessment
- Color differences
- Methodological considerations for subjective QA studies
Contact: dr. ir. Benhur Ortiz-Jaramillo, dr. ir. Ljiljana Platisa, dr. ir. Asli Kumcu
Content-aware video quality assessment
Prediction of perceived video quality (PVQ) is an important task for increasing the user satisfaction of video-based systems - not only for evaluating the systems but also for real-time control of, for example, streaming parameters. However, the correlation between PVQ and existing video quality metrics (VQMs) varies across different video content: for one type of scene content, a given metric can be well correlated to humans while at the same time for another type of scene content the correlation is poor. Figure 1 shows three different contents (shots 1, 2, 3) that clearly differ in perceived quality (51%, 70%, 86%) yet their corresponding VQM values (here we show PSNR, for illustration only) are exactly the same (33 dB).
To address the problem of strong VQM dependency on video content, we developed a method to induce content-awareness in the VQMs. Our proposed method is based on analyzing the level of spatial and temporal activity in the video and using those as parameters of an anthropomorphic video distortion model. By doing so, performance of existing VQMs can be increased by up to 20%.
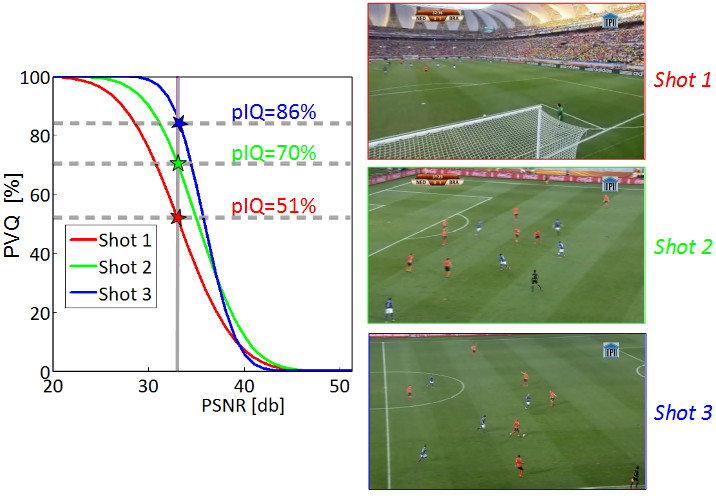
Figure 1: Perceived video quality (PVQ) of Shots 1, 2 and 3 is 51%, 70% and 86%, respectively. However, due to the lack of content-awareness, the PSNR measure fails to predict the PVQs; the PSNR values for all three shots are the same (33dB).
Figure 2 shows an example where the state-of-the-art VQM known as the Standard Objective Video Quality Metric (SOVQM, green line in the plot) fails due to the content of the source video. However, thanks to the content awareness induced by our proposed measure, even PSNR is able to agree with human perception in such a case (red line in the plot represents Content-aware PSNR, CPSNR).
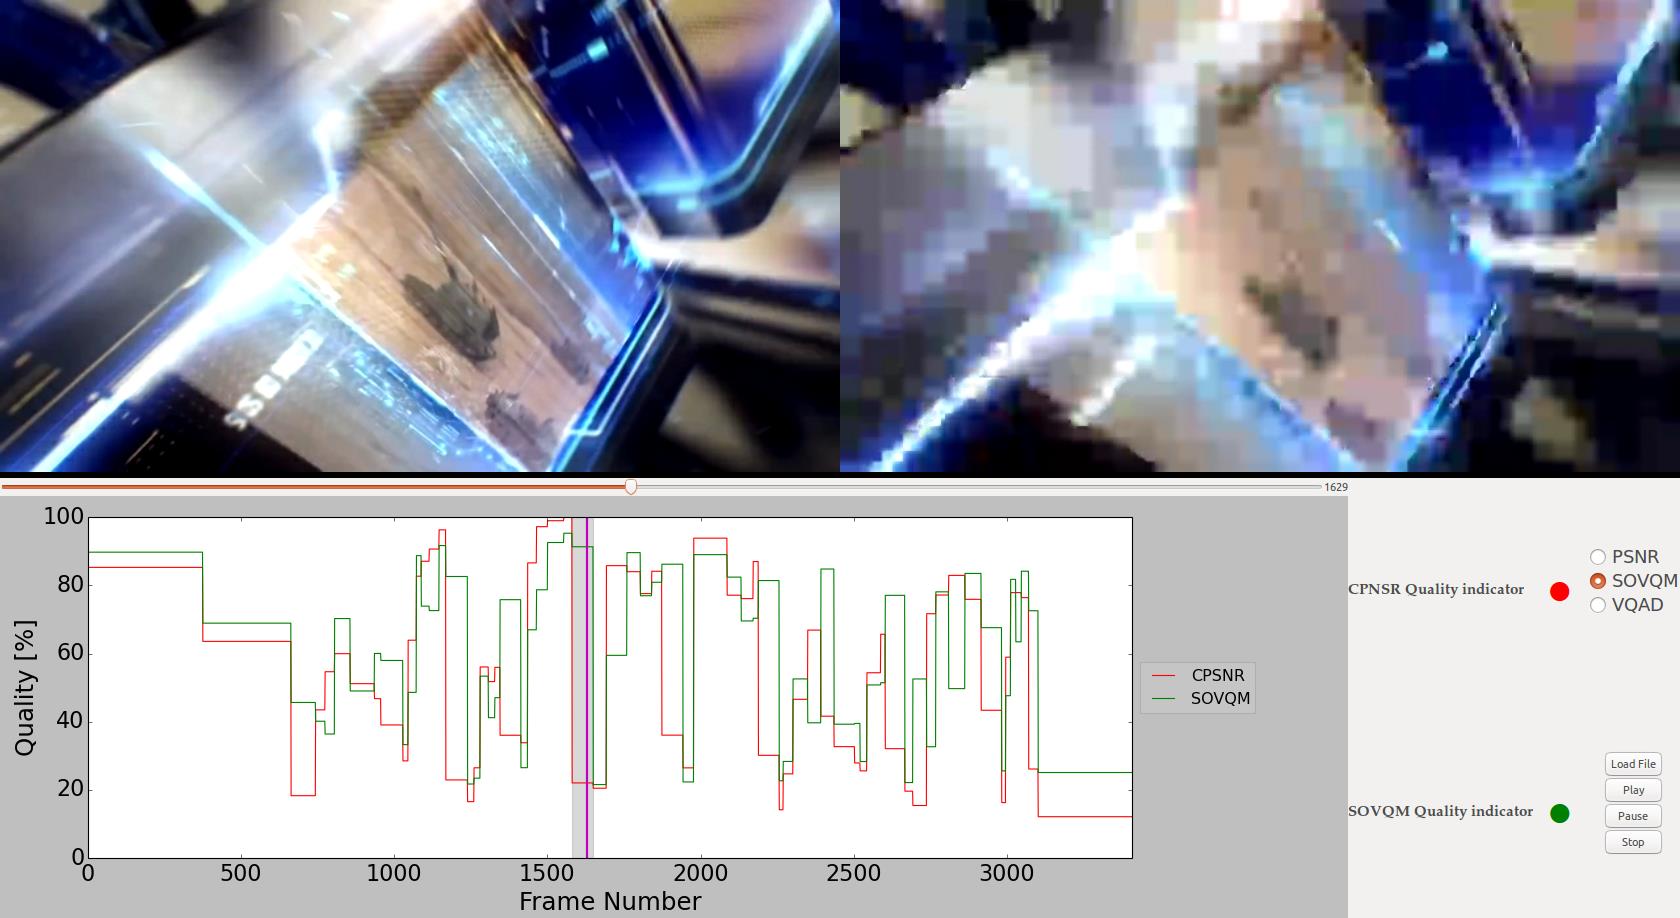
Figure 2: Video quality analyzer screenshot. The screenshot shows the comparison between SOVQM vs. proposed CPSNR. Left and right side images correspond to the reference and distorted sequences. The plot is the instant quality for a given frame.
[SOVQM] M.H. Pinson and S. Wolf, "A New Standardized Method for Objectively Measuring Video Quality", In IEEE transactions in broadcasting, vol. 50, no. 3, pp. 312-322, 2004.
References:
- B. Ortiz-Jaramillo, J. Nino-Castaneda, L. Platisa, W. Philips, "Content-aware objective video quality assessment", Journal of Electronic Imaging, vol. 25, no. 1, pp. 013011 1-16, 2016.
Contact: dr. ir. Benhur Ortiz-Jaramillo
Color differences
Nowadays, color image difference assessment has become an active area in the research of color science and imaging technology due to its wide range of applications such as color correction, color quantization, color mapping, and color image similarity and retrieval (see Figure 1). While a number of methods have already been proposed, an objective evaluation and comparison of these is still lacking. We have tested 20 state-of-the-art measures of color difference in natural scene images to identify the best performing methods under specific applications, distortion types and image content. Summary of these experiments can be found here.
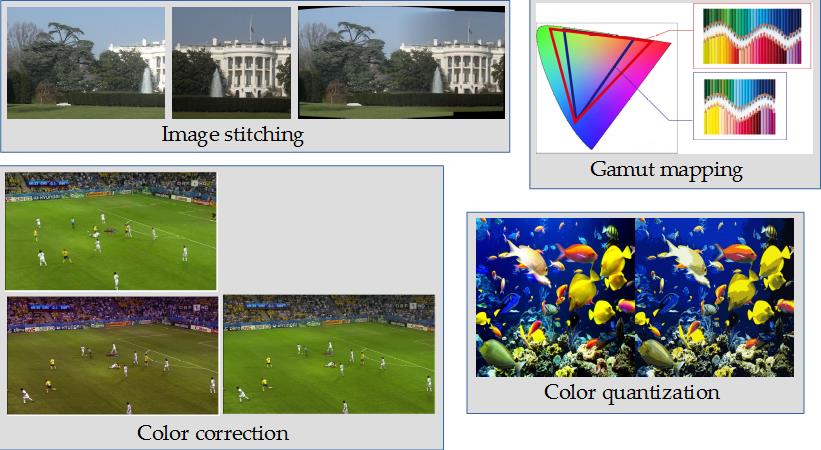
Figure 1: Different applications requiring color difference assessment
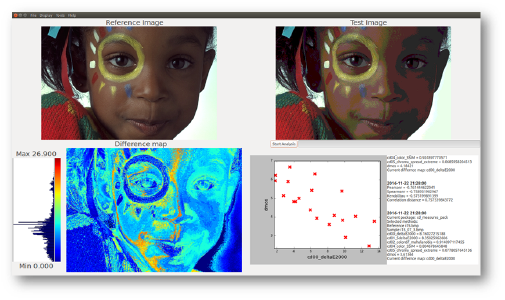
In addition, we have evaluated the level of agreement between perceived color difference and predicted color difference in an automatic color matching application in the broadcast domain, shown in Figure 2. Reference images were color distorted and then processed with five state-of-the-art color correction algorithms. Evaluation was conducted with imaging and broadcast human experts and with various color difference metrics.
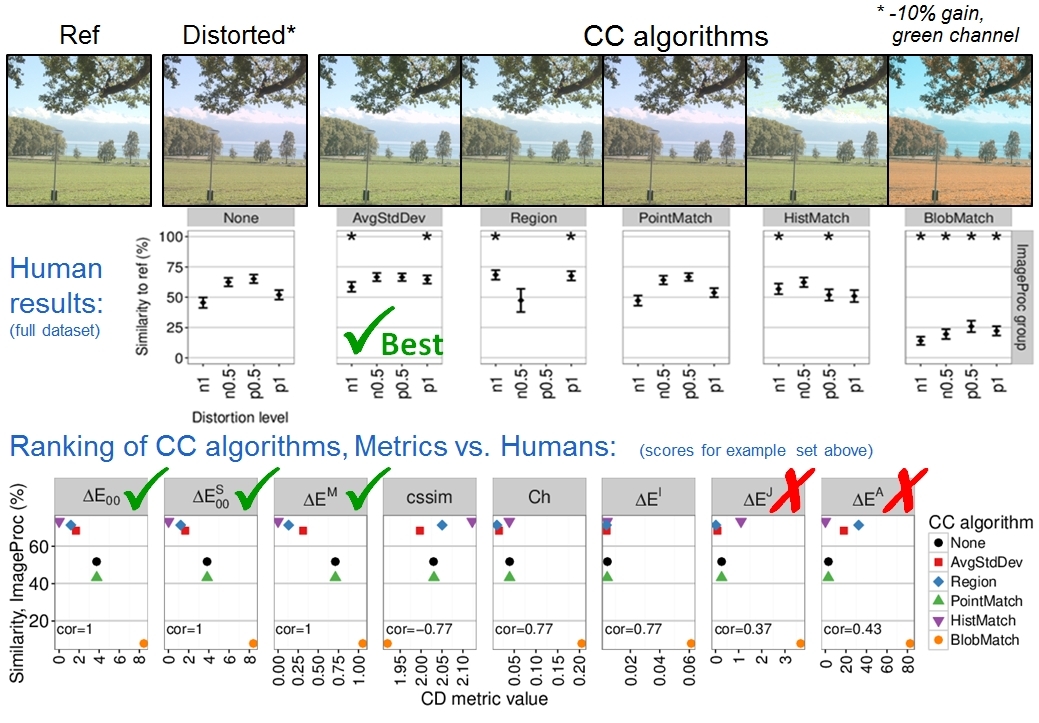
Figure 2: Assessment of the performance of 5 color correction algorithms with humans and 8 color difference metrics (the example shows one type of distortion at one level of distortion).
References:
B. Ortiz-Jaramillo, A. Kumcu, W. Philips, "Evaluating color difference measures in images", In International Conference on Quality of Multimedia Experience (QoMEX), Lisbon, Portugal, pp. 1-6, 2016.
Contact: dr. ir. Benhur Ortiz-Jaramillo
Methodological considerations for subjective QA studies
Quantification of imaging system performance and training/validation of objective quality assessment (QA) algorithms both require accurate estimation of subjective image and video quality. Two important considerations that will affect quality estimation accuracy when preparing subjective QA studies are the selection of the stimuli and the QA protocol.
First, the stimuli in QA studies typically consist of a reference sequence that has been distorted at various levels, for example by compression. The question is: which levels of distortion should be tested and what is the best way to select them? The problem is that many types of distortions often have a non-linear relationship with human perception, e.g. the perceived quality of a video compressed at 40 and 45 Mbps may be very similar, while the difference between 1 and 5 Mbps may be perceived as very large. In this case, selection of levels using the 'technical parameter' of bit-rate (e.g. 1, 5, 15, 25 Mbps) will result in over-sampling at the high quality levels and under-sampling at the lower quality levels. We propose a stimulus selection methodology using a paired comparison protocol to determine the relationship between the 'perceived quality distances' and the technical parameter values, shown in Figure 1. The optimal parameter levels can then be chosen based on their desired location in the perceived quality space. The experiment can be conducted with a limited number of subjects.
Figure 1: Methodology to determine optimal parameter levels for a subjective QA study, using a paired-comparison protocol. Example shown for video compression bit-rate, megabits per second (Mbps).
Second, the type of protocol used to gather and analyze quality scores is important. The International Telecommunication Union (ITU) offers various recommendations for subjective testing protocols, including paired comparison (PC), double stimulus (DS), and single stimulus (SS) methods - see for example ITU recommendations BT.500, P.910, and P.915. In addition, many studies often pre-process or transform the raw ratings generated from a given protocol, even though some of these techniques are not standardized. Ratings may also be analyzed using different statistical methods. We conducted a study to assess the effects of protocol, post-processing of raw scores, type of statistical analysis, and the size of the quality differences in the dataset. H.264 compressed medical videos and denoised natural scene videos were evaluated by expert and naive subjects. We found that in general the PC methods using an interval-scale and the SS method with Z-score transformation consistently outperformed the other methods, especially for small differences in quality levels (e.g. 1.85 and 2.9 Mbps). For the subset of stimuli with large quality differences (e.g. the reference and 1.85 Mbps), almost all methods were able to detect statistically significant differences in quality scores. The "best" protocol for a particular experiment may depend on the expected quality differences - when small differences are present, an interval-scale PC may be most sensitive. When SS protocols are used, transformation of raw scores may be beneficial.
References:
A. Kumcu, L. Platisa, H. Chen, A. J. Gislason-Lee, A. G. Davies, P. Schelkens, Y. Taeymans and W. Philips, "Selecting stimuli parameters for video quality assessment studies based on perceptual similarity distances," Proc. SPIE 9399, Image Processing: Algorithms and Systems XIII, 9399, 93990F-93990F-10, 2015 A. Kumcu, K. Bombeke, L. Platisa, L. Jovanov and W. Philips, "Performance of four subjective video quality assessment protocols and impact of different rating pre-processing and analysis methods," IEEE Journal of Selected Topics in Signal Processing, Special Issue on Measuring Quality of Experience for Advanced Media Technologies and Services, 2016
Contact: dr. ir. Asli Kumcu